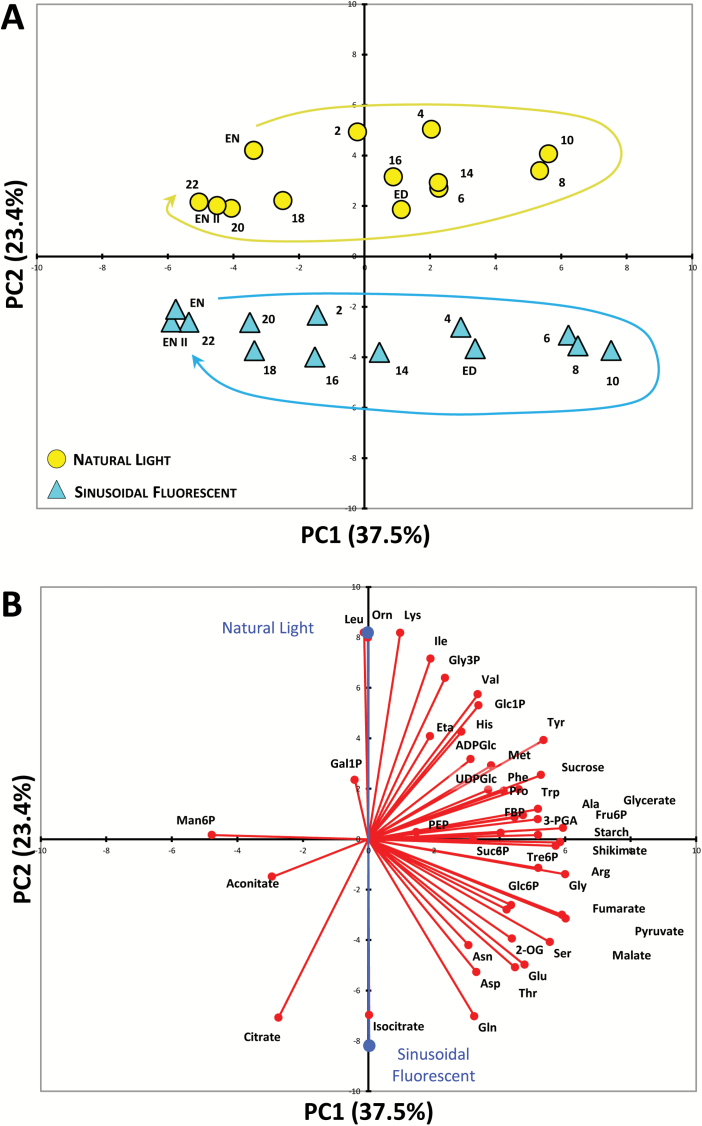
Fig. 5.
Principal component analysis (PCA) of metabolite data from arabidopsis plants. (A) PCA of metabolite data from plants grown in a naturally illuminated greenhouse (yellow circles) or in a controlled environment chamber with a 12-h photoperiod and daily light integral (DLI) of 12 mol m−2 d−1. The artificial illumination was provided by white fluorescent tubes with a sinusoidal (blue triangles) light profile during the day. Numbers indicate the time of harvest in hours after dawn (zeitgeber time, ZT); ED, end of day (ZT12); EN I, end of preceding night (ZT0); EN II, end of night (ZT24), and the diurnal trajectories are indicated by the arrows. The percentages of total variance represented by principal component 1 (PC1) and principal component 2 (PC2) are shown in parentheses. (B) The loadings of individual metabolites (red) on the principal components shown in (A) and the (average) loadings of the individual experimental conditions (blue). Glucose and fructose were not included in the PCA due to the very high variability in the data.

