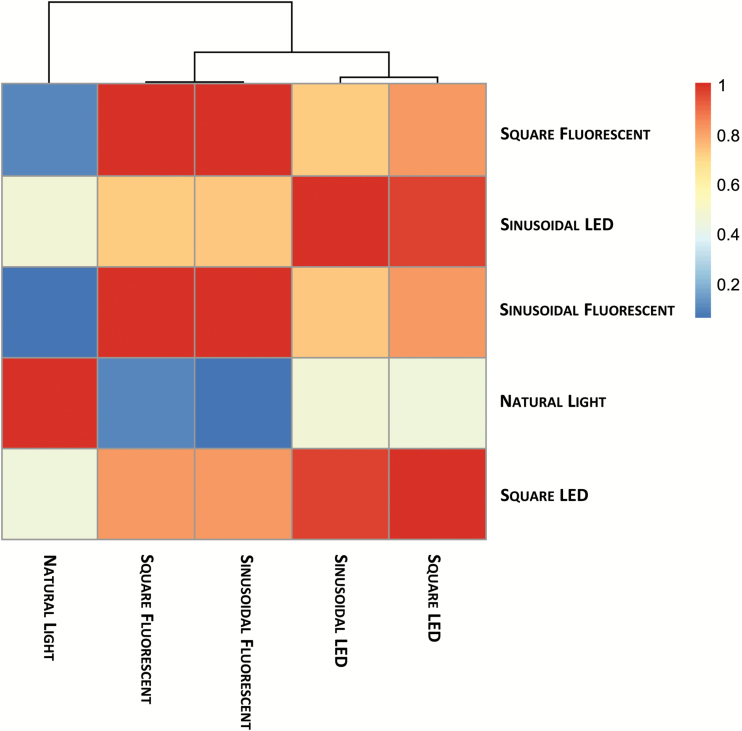
Fig. 6.
RV coefficient and correlation-based clustering of metabolite time-series data. Metabolite time-series data from Arabidopsis thaliana plants grown under natural or artificial light regimes with a 12-h photoperiod and daily light integral (DLI) of 7 mol m−2 d−1 were analysed by correlation-based clustering. A similarity score was calculated for each pair of growth conditions based on the covariance between the time-series of metabolite data. The results are displayed as a heat map with colours indicating the similarity score, where a value of 0 (blue) indicates no similarity and 1 (red) indicates complete correspondence of the compared covariance structures.

