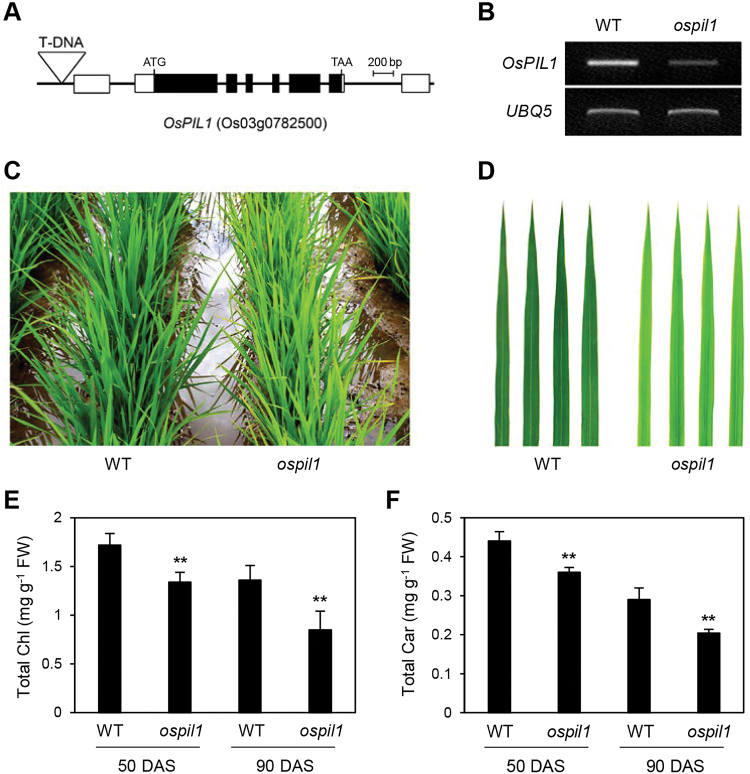
Fig. 1.
Pale-green leaf phenotype of ospil1 mutants grown in a paddy field. (A) Gene structure and T-DNA insertion site (inverted triangle) in the 1000-bp upstream region of OsPIL1 (PFG_4A-03590.R). (B) Decrease in OsPIL1 transcript levels in the ospil1 mutant confirmed by RT-PCR. UBQ5 was used for an internal control. (C, D) Color difference in whole plants (C) and the first leaf of the main culm (D) between WT and ospil1 at 70 d after sowing (DAS). (E, F) Reduced levels of total Chl (E) and Car (F) in ospil1. The first leaves of the main culm at 50 and 90 DAS were used for analysis. Means and SD were obtained from 10 biological replicates. Significant differences between WT and ospil1 was determined by Student’s t-test (** P<0.01).

