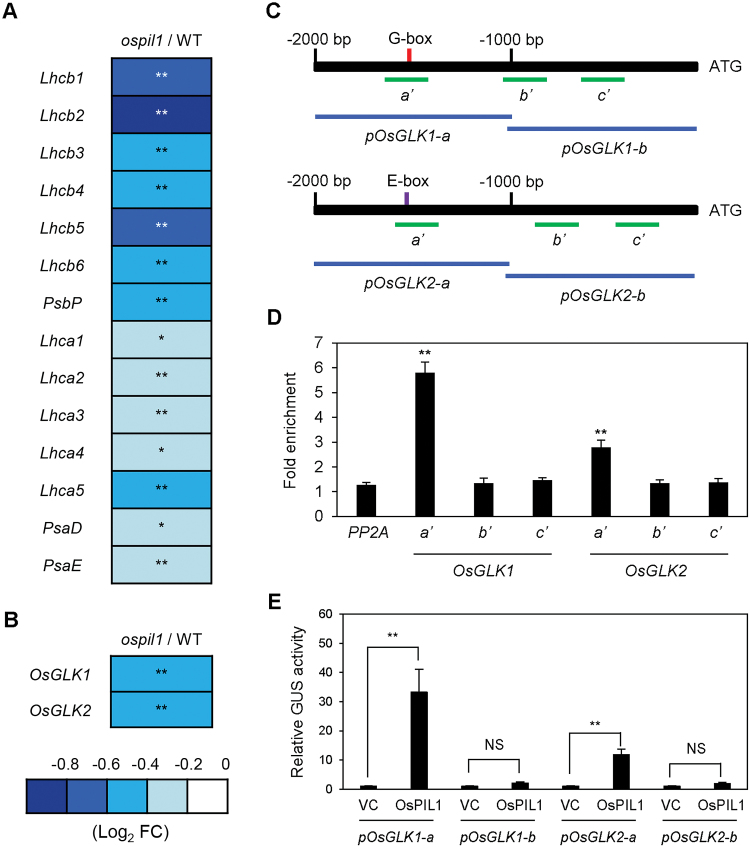
Fig. 4.
OsPIL1 directly promotes the expression of OsGLK1 and OsGLK2. (A, B) Relative expression levels (ospil1/WT) of photosynthetic apparatus genes (A) and two GLK genes (B). Relative expression levels of genes in ospil1 are normalized to those of the WT. Asterisks indicate significant difference between the WT and ospil1 plants (Student’s t-test, * P<0.05, ** P<0.01). (C) Positions of the G-box (red vertical bar) and E-box (purple vertical bar) in the OsGLK1 and OsGLK2 promoters and the promoter fragments (green horizontal bars) used for ChIP and transactivation assays. (D) The binding affinity of OsPIL1 to the promoter regions of OsGLK1 and OsGLK2 in planta examined by ChIP assay. OsPIL1-GFP was transiently expressed in protoplasts isolated from 10-d-old WT seedlings. Fold-enrichment of the promoter fragments was measured by immunoprecipitation with anti-GFP antibody (see Methods). PP2A was used as a negative control. (E) Transactivation of OsGLK1 and OsGLK2 by OsPIL1. The protoplasts were co-transfected with 5 μl of effector plasmid containing 35S:OsPIL1-GFP and 3 μl of reporter plasmids containing pOsGLK1-a::GUS, pOsGLK1-b::GUS, and pOsGLK2-a::GUS, and pOsGLK2-b::GUS. Empty vector was used as a vector control for the effector. Significant differences were determined by Student’s t-test (* P<0.05, ** P<0.01, NS, not significant).

