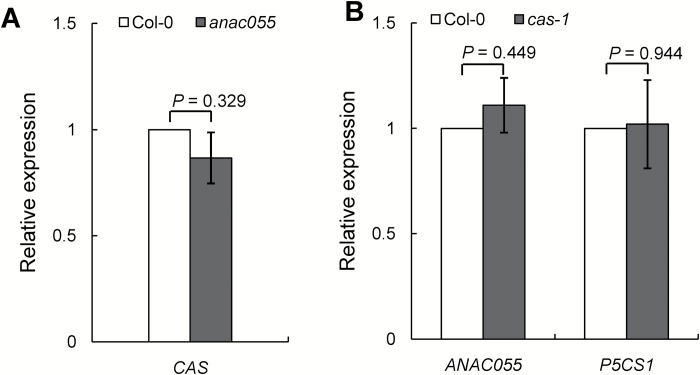
Fig. 6.
Analyses of transcript levels of CAS in the anac055 mutant, and ANAC055 and P5CS1 in the cas-1 mutant. (A) RT-PCR amplification of CAS in anac055. (B) RT-PCR amplification of ANAC055 and P5CS1 in cas-1. SAND (AT2G28390) was used as an internal control. Values are means ±SE, n=3. Statistical significance was determined by t-tests.

