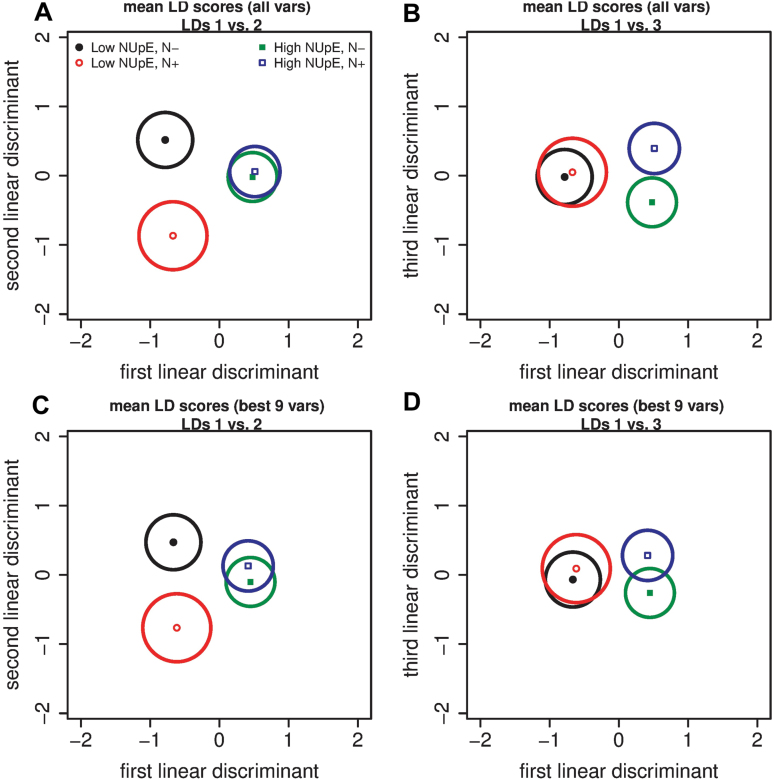
Fig. 7.
The mean linear discriminant scores with 99% confidence regions for the LDA with all variables (A, B) and with the subset of the best nine variables identified using the subselect package in R (C, D). (A) LD1 versus LD2 for all variables; (B) LD1 versus LD3 for all variables; (C) LD1 versus LD2 for the nine best variables; and (D) LD1 versus LD3 for the nine best variables

