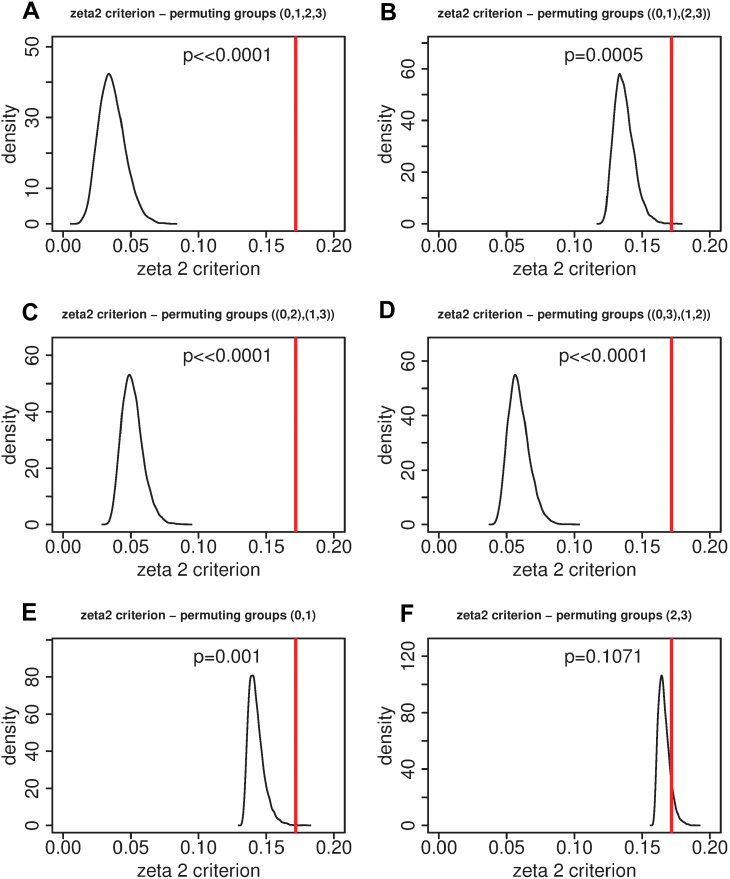
Fig. 8.
The ς2 (zeta2) criterion in permutation tests with N=10 000 permutations of the grouping variable. The vertical line indicates the result obtained with the true groupings. Group elements within brackets are permuted, so for example [(0,1),(2,3)] means that group labels are permuted within the subgroup (0,1) and within the subgroup (2,3). The meanings of the codes are: 0, low NUpE, low-nitrate medium; 1, low NUpE, high-nitrate medium; 2, high NUpE, low-nitrate medium; 3, high NUpE, high-nitrate medium. (A) Permuting group labels across all four groups. (B) Permuting group labels within low (0,1) and high (2,3) NUpE. (C) Permuting group labels within low-N (0,2) and high-N (1,3) media. (D) Permuting group labels within groups (0,3) and (1,2). (E) Permuting group labels within low NUpE, leaving high-NUpE group labels constant. (F) Permuting group labels within high NUpE, leaving low-NUpE group labels constant. The P-values show the probability of observing a zeta2 criterion as large as obtained with true group labels if the distribution obtained under permutation was the true distribution. (This figure is available in colour at JXB online.)

