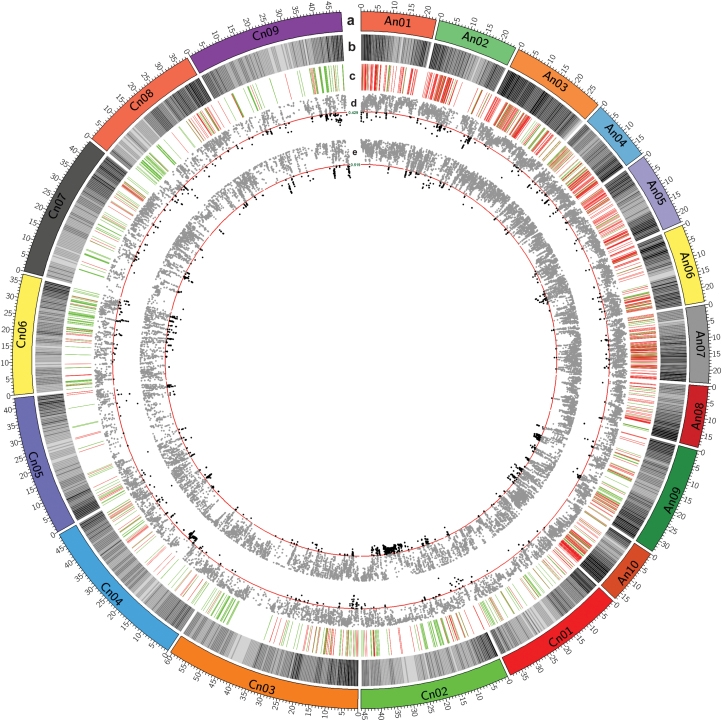
Fig. 2.
Concentric circles of population differentiation among ecotype groups of Brassica napus. (a) Chromosome; (b) heat map view of genes; (c) distribution of weak LD regions (red) and strong LD regions (green) in 10 kb window regions across the whole genome; (d) scatter spots distribution of FST in semi-winter versus winter/spring ecotype groups; (e) scatter spots distribution of FST in winter versus spring ecotype groups. The top 5% of FST values above the threshold line (red) were emphasized with a dark spot.

