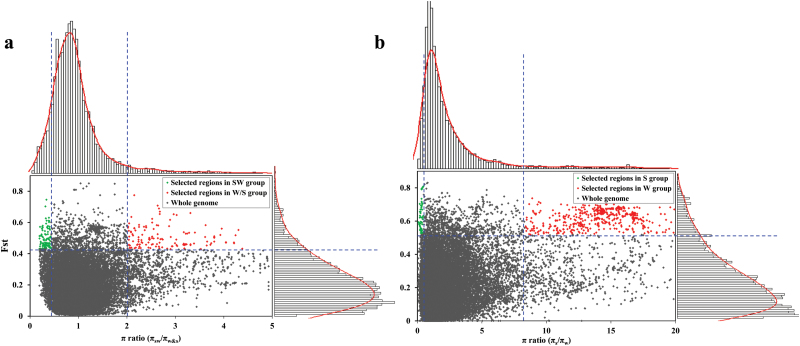
Fig. 3.
Selective signals in the whole genome between different rapeseed ecotypes. (a) Comparison between semi-winter (SW) and winter/spring (W/S) ecotypes. (b) Comparison between spring (S) and winter (W) ecotypes. The π ratios (πsw/πw&s and πs/πw) and FST values were calculated in a sliding window approach with 10 kb steps in a 100 kb window. The dashed blue lines correspond to the 5% left and right tails of the empirical π ratio distribution, where the π ratios are 0.43 and 2.02 for semi-winter and winter/spring groups (a) and 0.48 and 8.35 for spring and winter groups (b), respectively. Data points located to the left and right of the vertical dashed blue lines and above the horizontal dashed blue line [the 5% right tail of the empirical FST distribution, where FST is 0.429 in (a) and 0.519 in (b)] are indicative of selected regions for the SW group (green dots) and W/S group (red dots) in (a), and for the S group (green dots) and W group (red dots) in (b).

