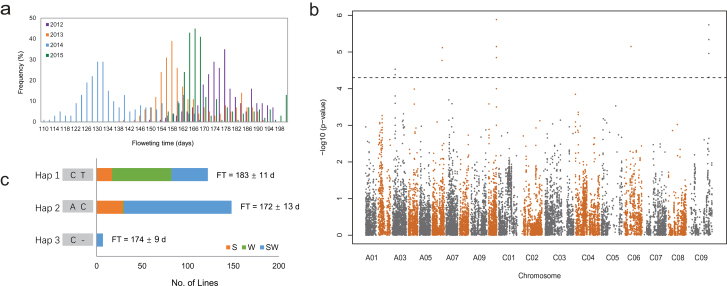
Fig. 6.
Genome-wide association study (GWAS) and haplotype analysis for flowering time (FT). (a) The frequency distribution of FT across 4 years. (b) Manhattan plots of GWAS for FT. The black dotted line represents the significant level, −log10(P-value) >4.3. (c) Haplotype analysis for FT in two SNPs (6 450 533 and 6 450 763) on chromosome A03, linked with BnaA03g13630D (homologous to Arabidopsis Ath.FLC). S, W, and SW indicate the spring, winter, and semi-winter rapeseed group, respectively.

