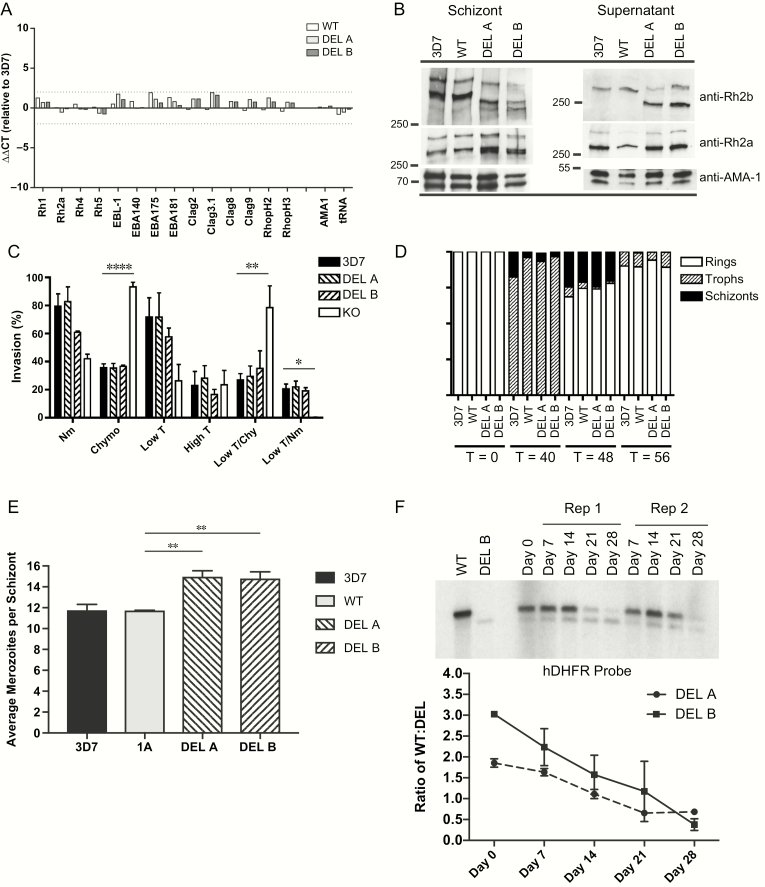
Figure 1.
The PfRh2b deletion does not affect alternative invasion pathway utilization but shows a competitive growth advantage over time. A, Quantitative PCR was employed to determine differences in invasion gene expression between DEL clones and WT control. CT values were compared relative to AMA-1 (∆CT). Data are expressed as fold change (∆∆CT) values relative to 3D7. Clag 3.2 is not shown as it is not expressed in the 3D7 clone used. B, Western blots of synchronous schizont material and invasion supernatants were performed. Samples were adjusted relative to the schizont stage–specific proteins PfAMA-1 for both schizont blots and supernatant blots. In schizonts, expected size of PfRh2b full-length protein (3D7, WT) is 382 kDa, which after proteolytic processing results in a 297 kDa cleavage product [45]; whereas the Deletion (DEL) results in a shorter protein which runs approximately 360 kDa with the cleavage product at 275 kDa. For PfRh2a, the unprocessed form runs at 370 kDa with a 285-kDa processed form. In supernatants, further processing results in an additional processed form of 290 kDa for PfRh2b (3D7, WT), 268 kDa (DEL), and 279 kDa for PfRh2a [45]. C, Invasion assays were performed to determine the erythrocyte receptor utilization for DEL clones compared to wild-type 3D7 and KO (3D7ΔPfRh2b). Percent invasion into enzyme-treated erythrocytes was calculated relative to invasion of the same parasite line into RPMI-treated erythrocytes. Assays were repeated 5 times, in triplicate, except for KO and DEL B (which were repeated twice, in triplicate). Values shown are the mean of all experiments; error bars represent SD. Overall significance is assessed by 1-way ANOVA; differences between columns are assessed with Dunnett test for multiple comparisons. Asterisks indicate significant differences (*P < .05; **P < .01; ***P < .001; ****P < .0001). KO invasion into lowT/Nm was tested, but is undetectable. D, Detailed measurements of invasion and growth were performed for PfRh2b deletion and control strains for 3 independent experiments, plated in duplicate. Erythrocytic cycle duration was measured for the 2 PfRh2b deletion (DEL A and DEL B) and control strains (3D7, WT) over 1 cycle. Stages were quantified morphologically at T = 0, T = 40, T = 48, and T = 56 hours postinvasion. A total of 300 parasitized cells were counted per time point; the average of the 3 experiments, plated in duplicate, is shown. E, Average merozoite number per schizont was calculated for transgenic parasites and controls. Data shown are from 3 independent experiments. Means and 95% CIs are shown. Overall significance is assessed by 1-way ANOVA; differences between columns are assessed with Dunnett test for multiple comparisons. Asterisks indicate significant differences (*P < .05; **P < .01; ***P < .001). F, Competitive growth assays were conducted in which DEL and WT were mixed in equal proportions and kept in in vitro culture for 1 month, with weekly gDNA harvests. Relative proportions of DEL and WT were assessed by Southern blot hybridization using a probe to human DHFR. A representative experiment is shown with DEL B and WT. Relative ratios of WT compared to DEL over time were calculated for both DEL A and DEL B clones, with 2 independent experiments per clone; error bars represent the range of the 2 experiments.
Abbreviations: ANOVA, analysis of variance; CIs, confidence intervals; CT, cycle threshold; DEL, PfRh2b deletion single crossover parasites; DHFR, dihydrofolate reductase; gDNA, genomic DNA; kDa, kilodalton; KO, 3D7∆2b, C2 parasites; lowT, low trypsin-treated erythrocytes; Nm, neuraminidase-treated erythrocytes; PCR, polymerase chain reaction; PfRh2b, Plasmodium falciparum reticulocyte-binding protein homologue 2b; RPMI, Roswell Park Memorial Institute; T, trypsin-treated erythrocytes; WT, PfRh2b wild-type replacement parasite line (1A).

