Fig. 1.
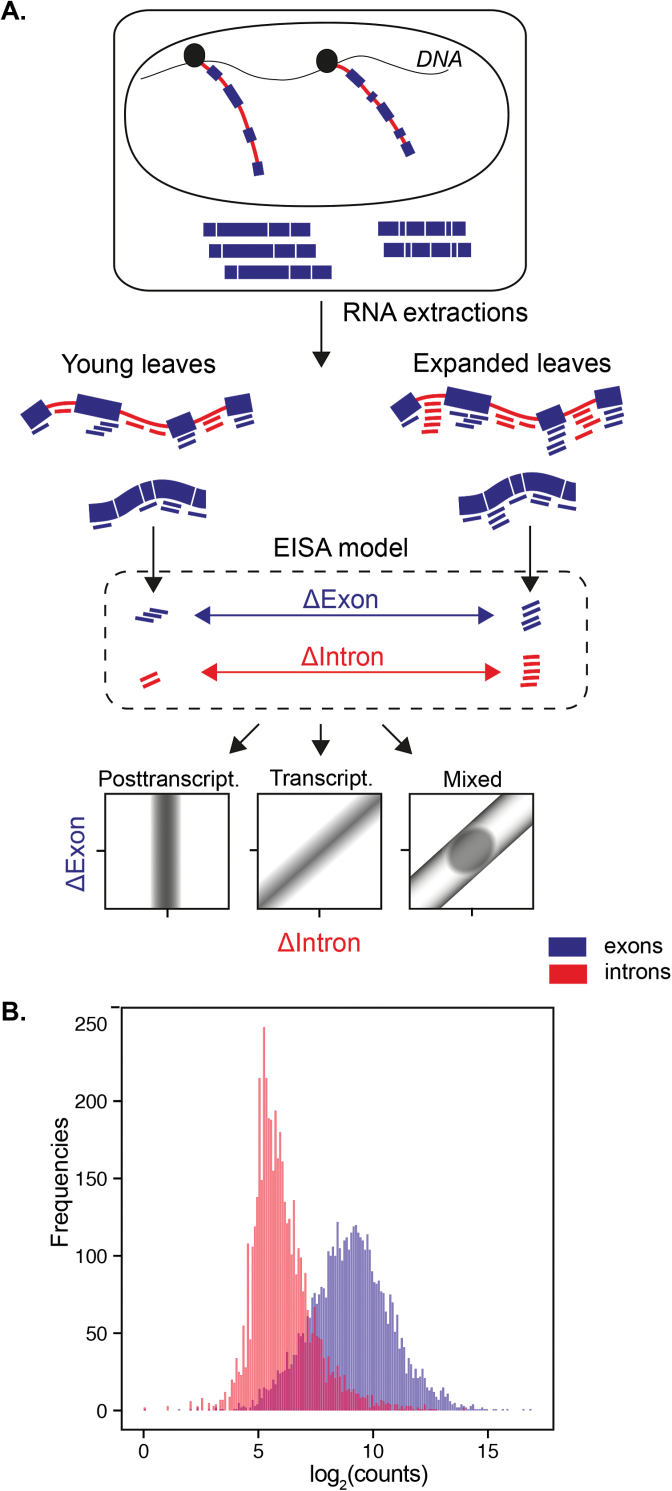
The exon–intron split analysis (EISA) detects the extent of gene expression regulation under post-transcriptional control between two experimental conditions. EISA was applied during leaf ontogeny between young and expanded leaves of G. gynandra and T. hassleriana. (A) Pre-mRNA comprising introns (red) and exons (blue) are transcribed in the nucleus, then spliced and translocated to the cytosol where the mature mRNA will be translated. EISA counts the differences in intronic (ΔIntron) and exonic (ΔExons) levels between the experimental conditions and compares them as a measure of post-transcriptional controls. The bottom part shows plots expressing ΔExon as a function of ΔIntron to show the possible patterns that are representative of the predominant mechanisms regulating gene expression (mostly transcriptional, post-transcriptional or a mixture of the two). The schematic representation was adapted from Gaidatzis et al. (2015). (B) RNA extraction results in a majority of reads mapping to exons but also reads originating from intronic segments.

