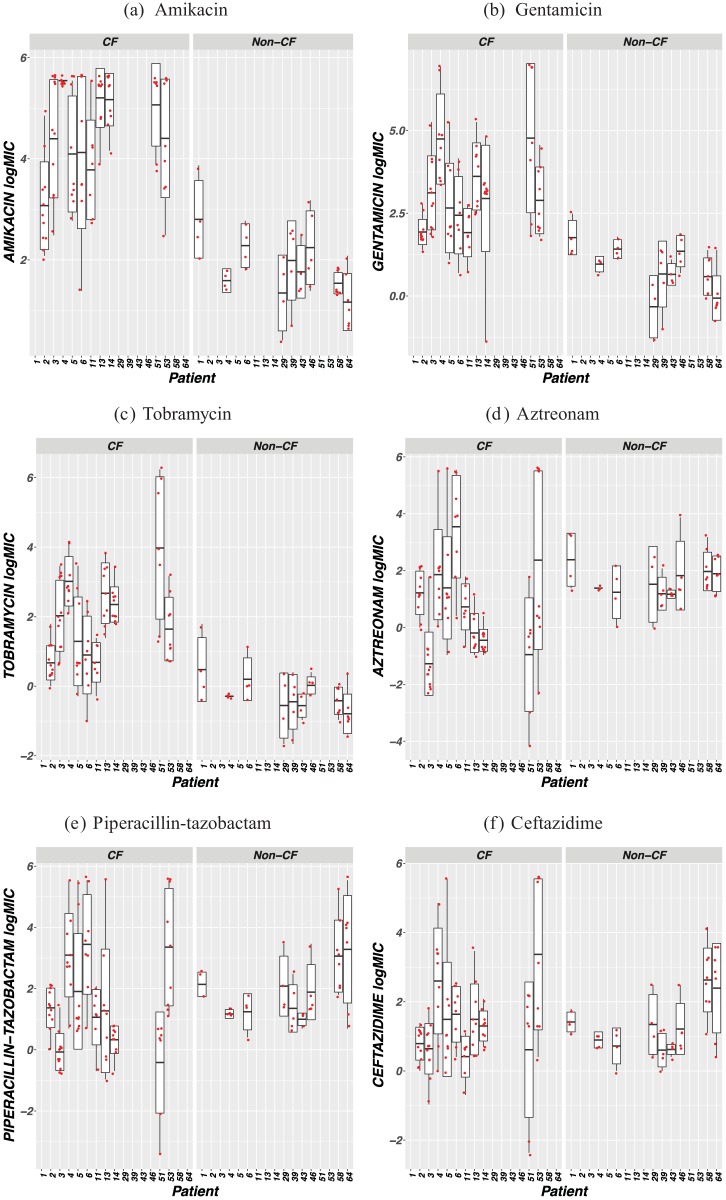
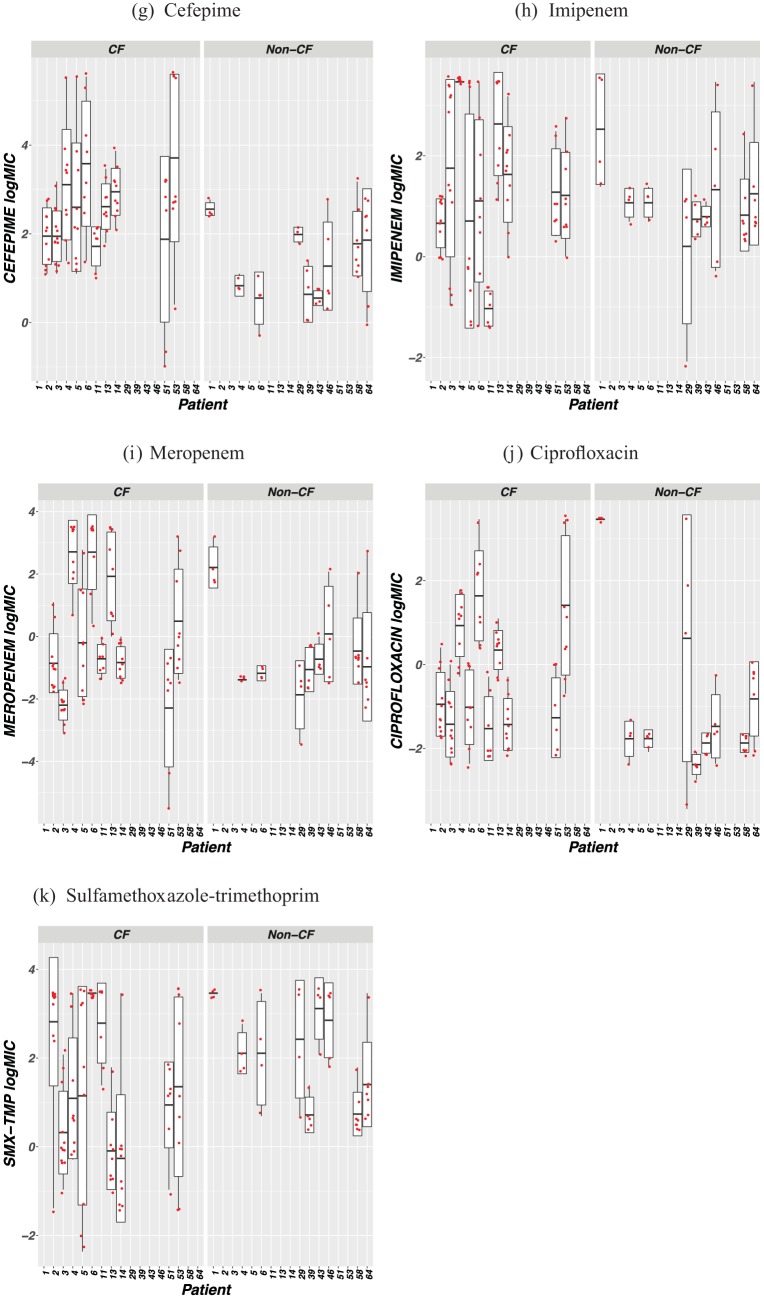
FIG 2 .
Antimicrobial logMIC distributions for P. aeruginosa isolates from selected patients in both CF and non-CF cohorts who contributed >4 isolates within the study period. The dots indicate the logMICs from patient-specific isolates, the vertical lines represent the range of logMICs, the box represents the lower (25%) quartile and upper (75%) quartile, and the horizontal line represents the median.


