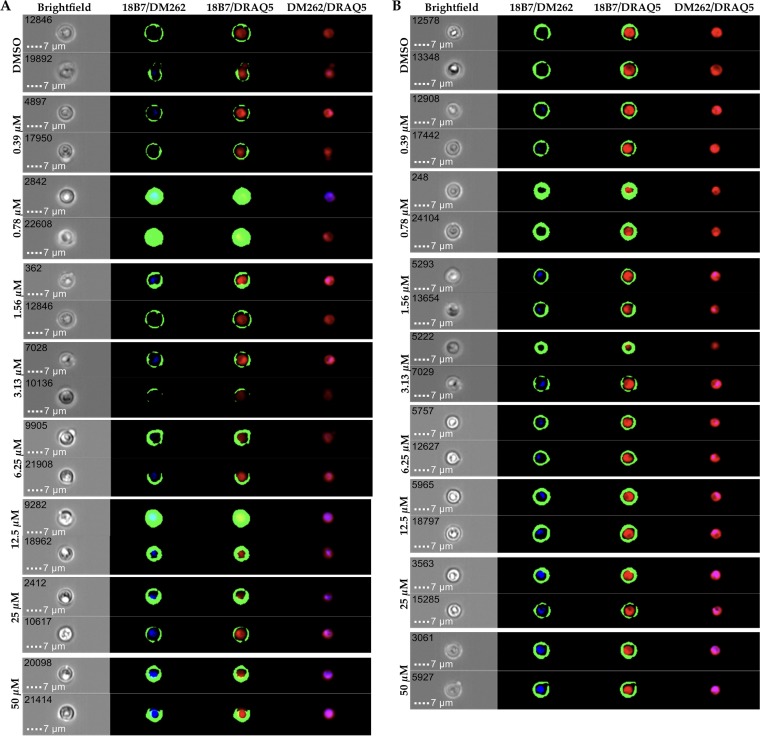
FIG 4.
Internalization of DM262 in C. neoformans. Each of the panels shows the bright-field image at ×60 magnification and three overlaid images indicated by the respective channels. (A) Two populations of cryptococcal cells were treated with either DMSO or 0.39 µM to 50 μM DM262 for 24 h prior to fixing and analysis on an Amnis ImageStream MK II flow cytometer. DRAQ5-stained nuclei (red) and AF488 (green)-stained 18B7 conjugated to the polysaccharide capsule of C. neoformans outlining the exterior of the cell. DM262 appears to associate partially with the nuclei in our investigation. Two cells from each sample at a particular DM262 concentration were chosen as representatives of the population with the brightest DM262 fluorescence. A complete analysis of all concentrations is available as Fig. S3 in the supplemental material. Representative images from ImageStream analysis highlighting the main differences between untreated and treated cells are in Fig. S4. (B) Samples from panel A were further analyzed by binning the average intensity of DM262 for the respective sample. Two cells were randomly picked from the bin corresponding to the mean intensity of DM262 for each concentration. This bin typically contained more than 50 cells.

