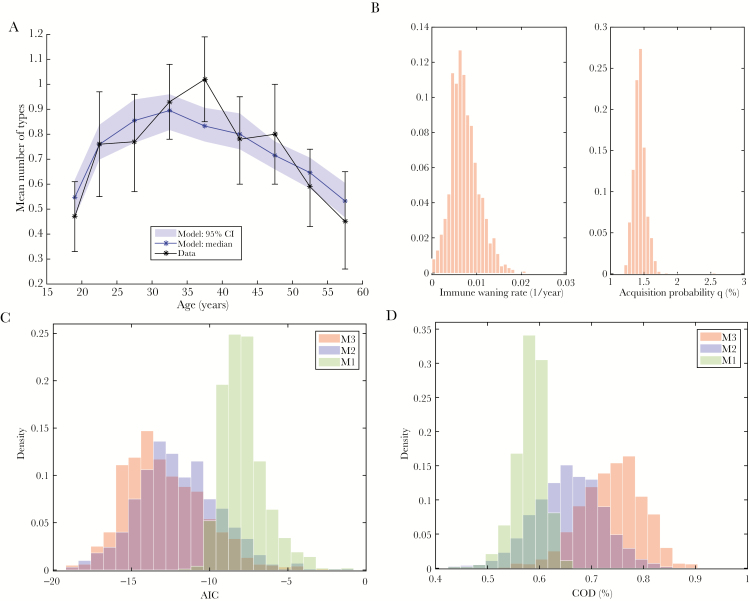
Figure 2.
Modeling of seroprevalence. A, Model M3 (blue: median and 95% credible interval [CI] of the quasi-posterior) is fit to the mean number of serotypes in the 2005–2006 National Health and Nutrition Examination Survey (black: point estimate and 95% confidence interval). B, Histograms approximating the quasi-posterior densities of the immune waning rate and the per-partnership human papillomavirus acquisition probability for model M3. C, Comparison of the quasi-posterior density of Akaike information criteria (AIC) in the best-fitting model (M3; red) to the corresponding densities for 2 alternative models, namely the model without immune waning (M1; blue), and the model without cohort effects in the partner acquisition rate (M2). D, Comparison of the coefficient of determination (COD) between models M1, M2, and M3 (as in C).

