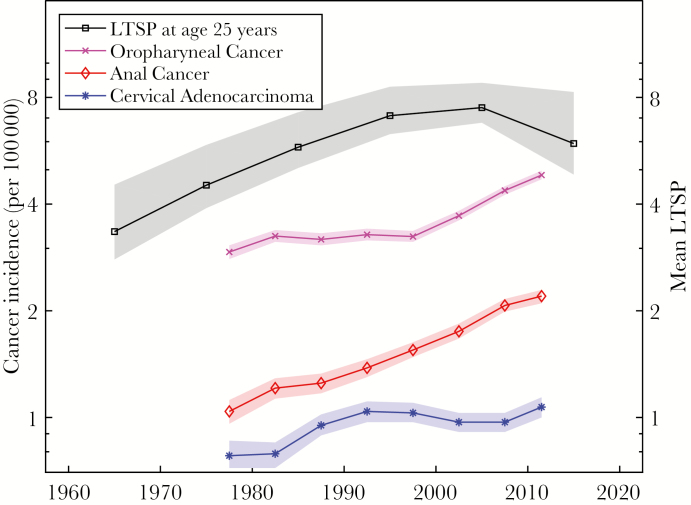
Figure 4.
Trends in sexual behaviors and cancer incidence. Age-adjusted incidence trends for adenocarcinomas of the cervix, and carcinomas of the oropharynx and anus (1975–2013, 5-year intervals; point estimate and 95% confidence interval) are compared to the modeled mean number of lifetime sex partners (LTSPs) among females of age 25 years (1965–2015, 10-year intervals; median and 95% credible interval). The y-axis for cancer incidence is on the left (logarithmic scale), and the y-axis for mean LTSPs is on the right (linear scale logarithmic scale).

