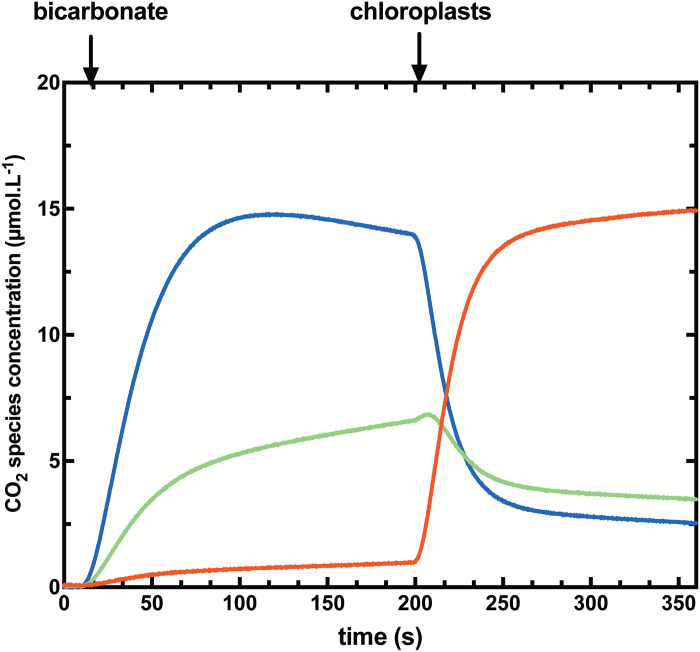
Fig. 3.
Typical time course for a highly 18O-enriched assay. Changes in concentrations of 13C18O18O (m/z=49, blue), 13C18O16O (m/z=47, green), and 13C16O16O (m/z=45, red) species are shown. Conditions were the same as Fig. 2 but using highly enriched [18O]Ci equilibrated against 99% [18O]water, instead of low 18O-enriched Ci.

