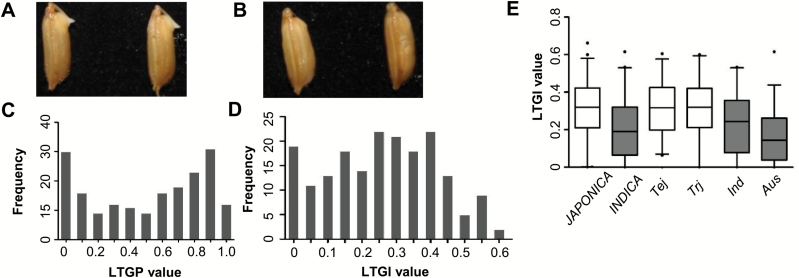
Fig. 1.
Phenotypic distribution in the 187 rice accessions. (A, B) Photographs of rice seeds showing the definition of germination (A) and no germination (B). (C, D) Frequency distribution of LTGP (C) and LTGI (D) among the 187 rice accessions. (E) Boxplot of the phenotypic variation of LTGI within varietal groups. The black horizontal lines represent the median values, the boxes represent the middle quartiles, the whiskers represent the range of data, and points represent outliers. (This figure is available in colour at JXB online.)

