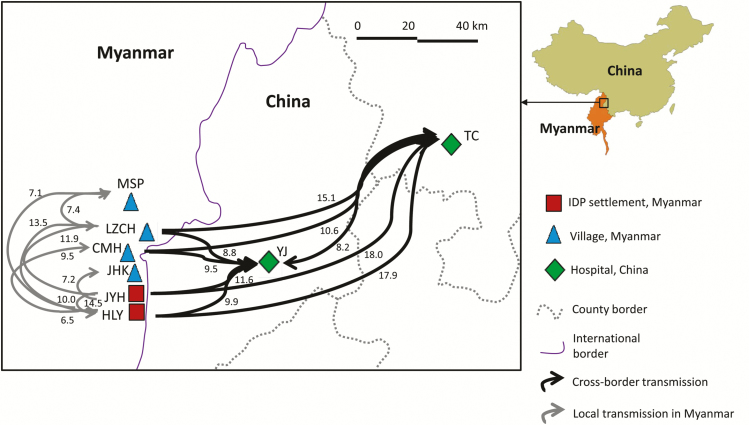
Figure 5.
Migratory pathways (arrows) and rates (number above arrows, M) among samples collected from clinics/hospitals located in 2 internally displaced person (IDP) settlements (Je Yang Hka [JYH] and Hpum Lum Yang [HLY]), a nearby military base (CMH), and 4 surrounding villages/towns (Ja Htu Kawng [JHK], Laiza [LZCH], Mai Sak Pa [MSP], and Mung Seng Yang [MSY]) in Myanmar and from 2 town hospitals (Tengchong [TC] and Yingjiang [YJ]) in Yunnan, China, during 2012. Values of Θ (defined as 4Neμ, where Ne is the effective population size and μ is the mutation rate per generation and site), M (in m/μ, where m is the immigration rate scaled by the mutation rate), and the number of effective migrants per generation Nem (ΘM/2 for haploid individuals) are presented in Supplementary Table 5. Only pathways with an M value of >5 are shown.

