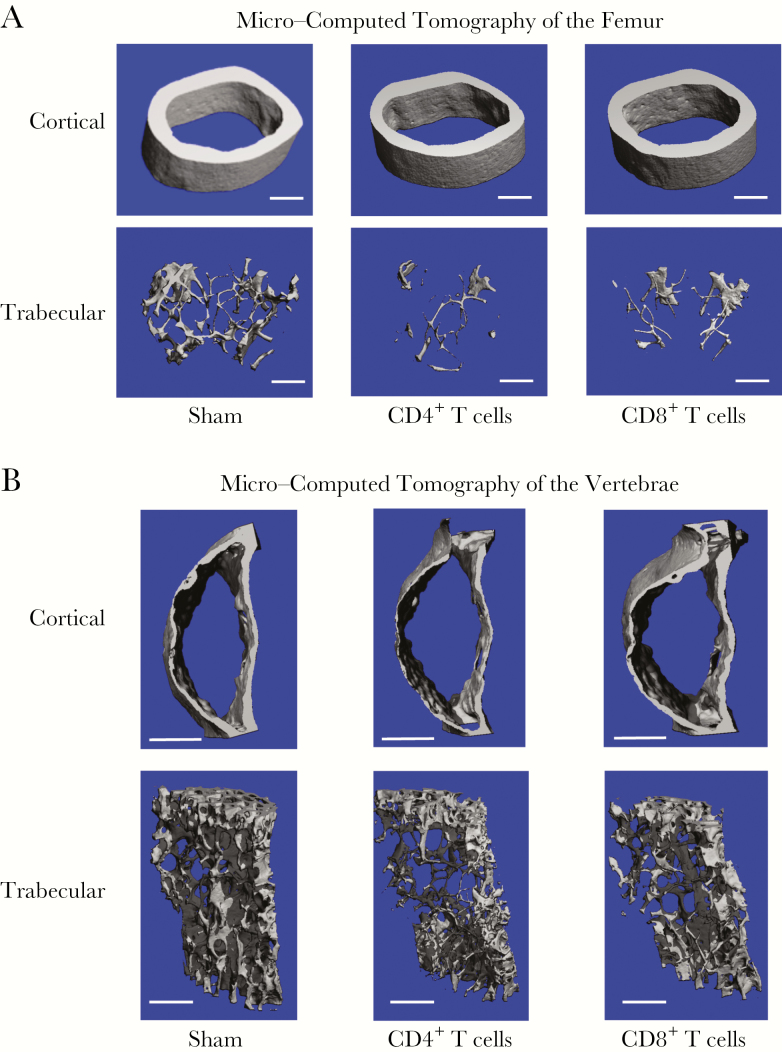
Figure 2.
Representative cortical and trabecular bone reconstructions from CD4+ or CD8+ T-cell–reconstituted mice by micro–computed tomography. Representative cortical (upper panels) and trabecular (lower panels) high-resolution (6-μm) 3-dimensional reconstructions of femurs (A) and vertebrae (B) from mice in the sham group and those in CD4+ and CD8+ T-cell–reconstituted groups 12 weeks after reconstitution. The length of the white scale bar represents 500 µm.

