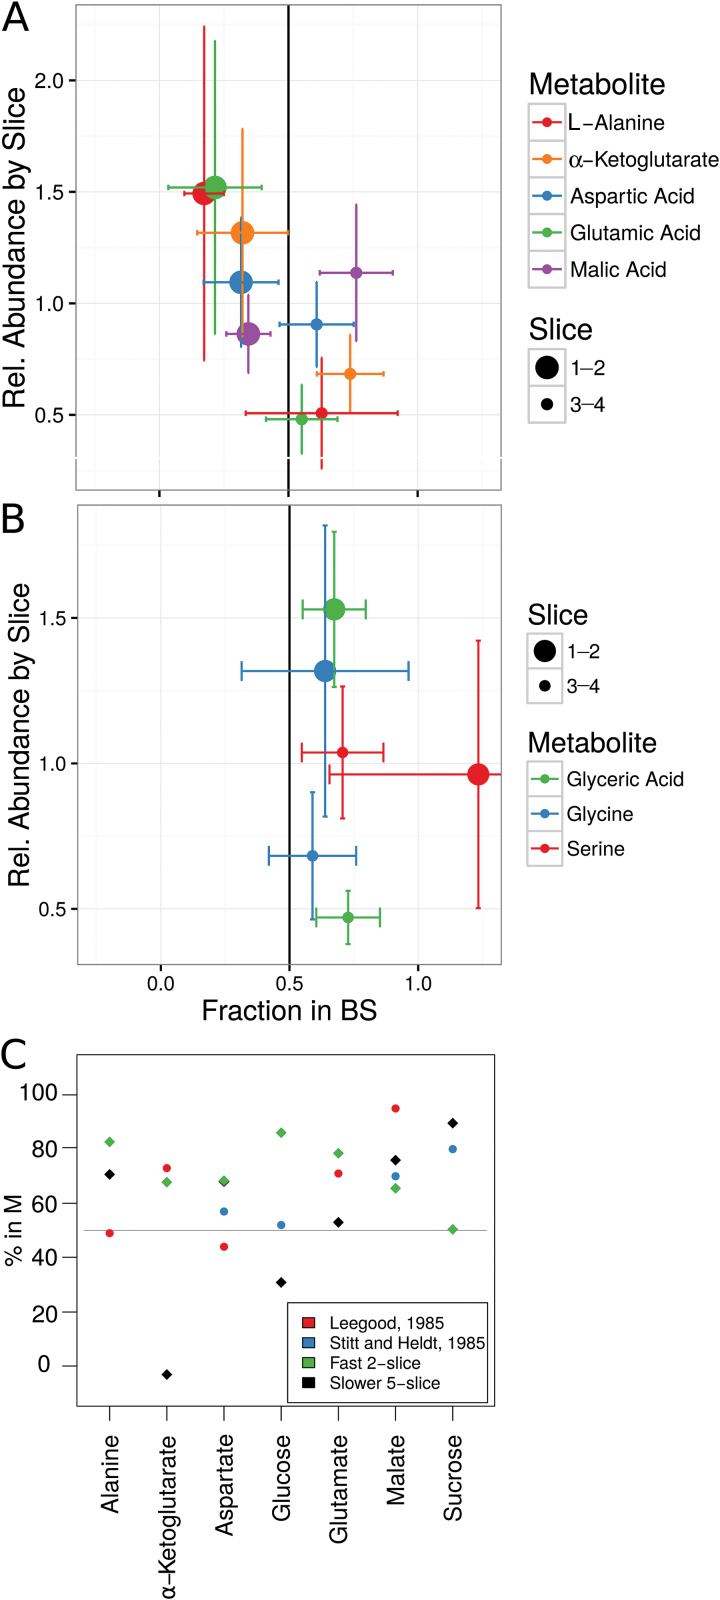
Fig. 1.
Metabolites. (A, B) The estimated tissue enrichment and abundance of measurable metabolites associated with the photorespiratory cycle (A) and the C4 cycle (B). Error bars indicate standard error. (C) Comparison of metabolite tissue enrichment measured by Leegood (1985) and Stitt and Heldt (1985) with the average of slice 1 and 2 in the slower five-slice harvest and slice 1–2 in the faster two-slice harvest.

