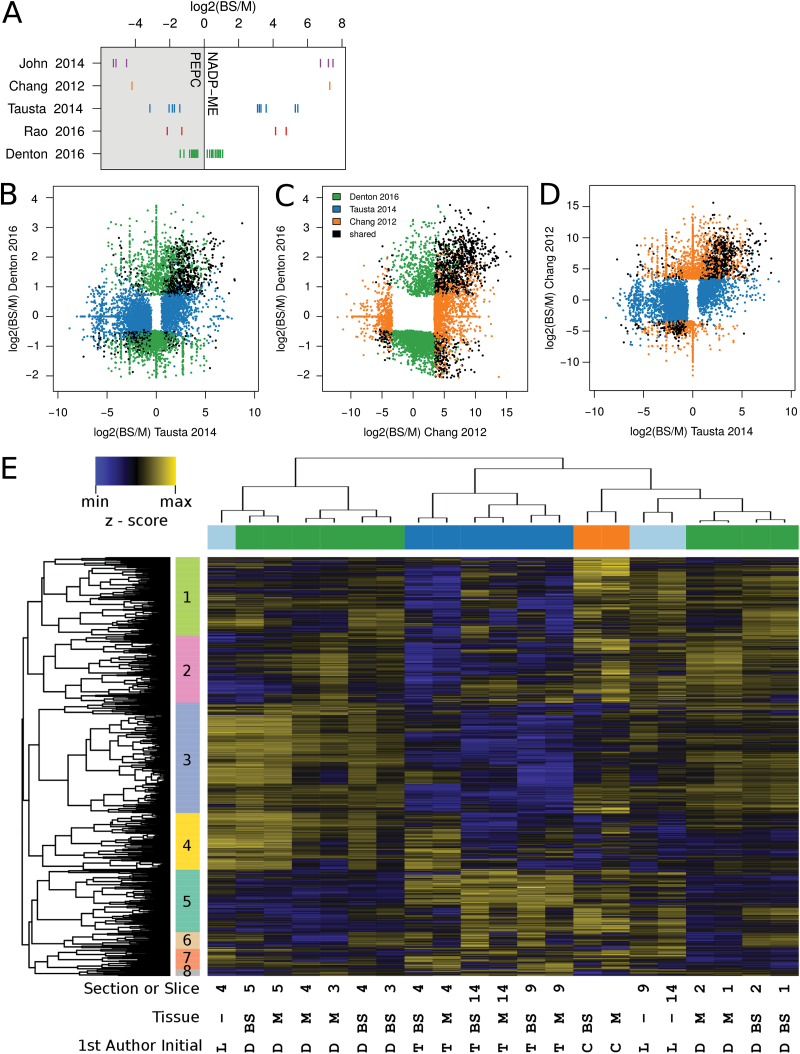
Fig. 2.
Interstudy comparison. (A) Enrichment of the classic BS (NADP-ME) and M (PEPC) marker genes in each study. (B–D) Log2 fold change of genes that were significantly enriched in BS or M in at least one of the paired Z. mays studies. (E) Hierarchical clustering of fully normalized log2 (TPM) for Z. mays samples, with Pearson and Spearman correlation-based distance for genes and samples, respectively. Genes filtered to those with TPM min>0, max>50. Side colors included to help delineate studies on the x-axis and major clusters on the y-axis. C, Chang et al. (2012); D, this study; L, Li et al. (2010); T, Tausta et al. (2014).

