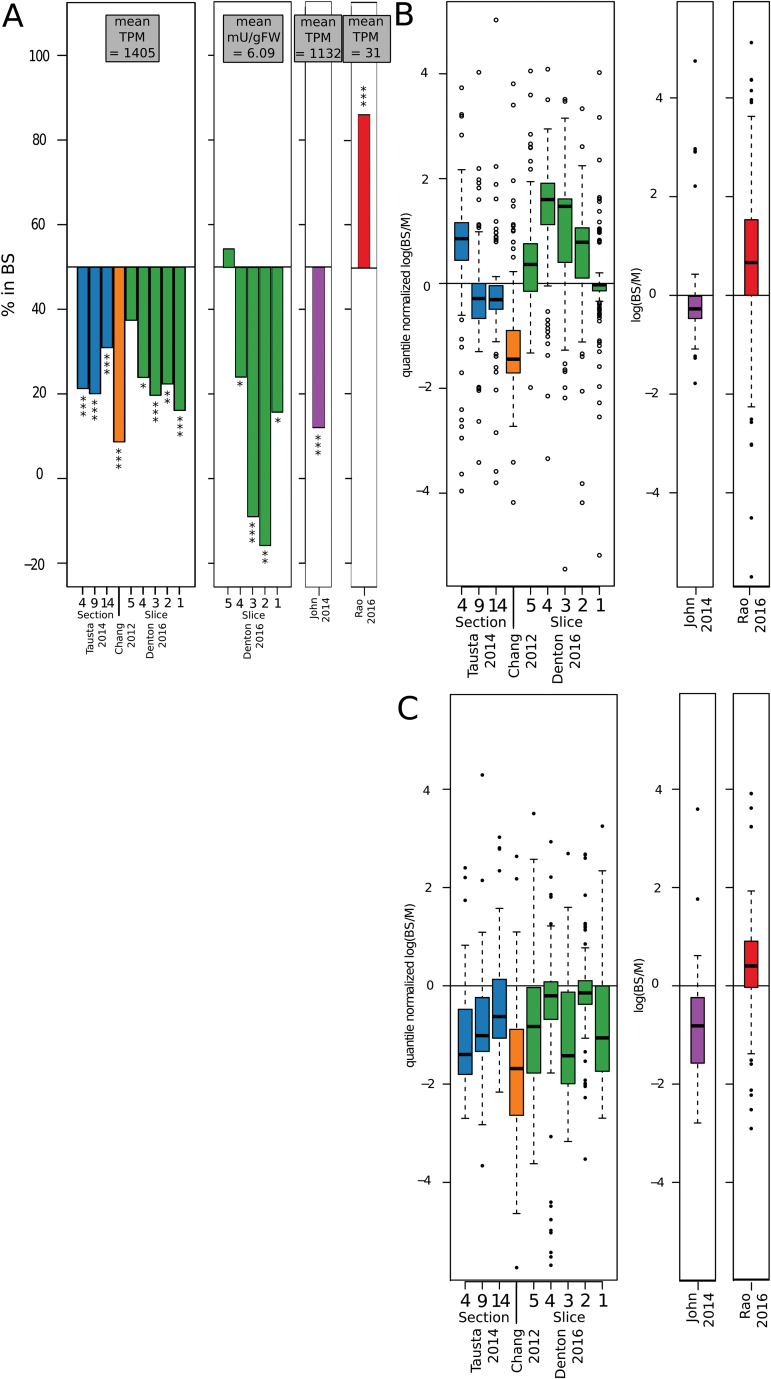
Fig. 6.
Biological insights drawn from interstudy comparison. (A) Tissue enrichment of AspAT of transcripts in maize (left), enzyme activity in Z. mays (mid-left), transcripts in S. viridis (mid-right) and transcripts in P. virgatum (right). (B, C) Tissue enrichment of transcripts in the MapMan functional category for 60S ribosomal protein (B) and photosystem II (C) in Z. mays (left), S. italica (middle), and P. virgatum (right). In (A) asterisks denote significance of FDR for transcripts and P-values for enzyme activity (*P<0.05, **P<0.01, ***P<0.001).

