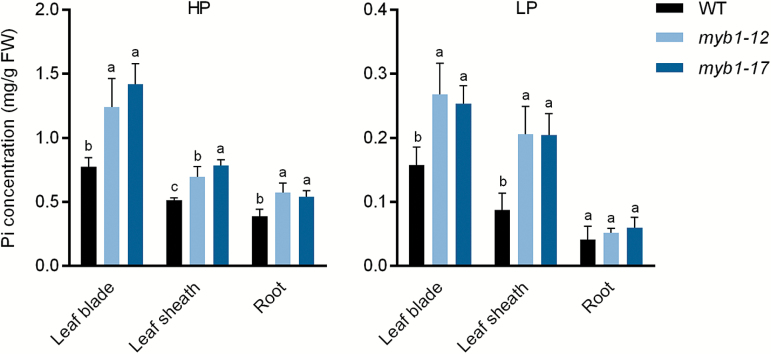
Fig. 6.
Concentration of Pi in leaf tissues and roots of WT and myb1 mutant plants. Four-leaf-old seedlings were grown hydroponically and supplied with 200 μM (HP) or 10 μM (LP) Pi until the seventh leaf blades were fully expanded. The Pi concentration was measured in plants grown under HP (left panel) and LP (right panel) conditions. Leaf blades, leaf sheaths, and roots were collected for measurement. Error bars indicate SD (n=6). Different letters indicate significant differences (P<0.05, Duncan’s test). FW, fresh weight.

