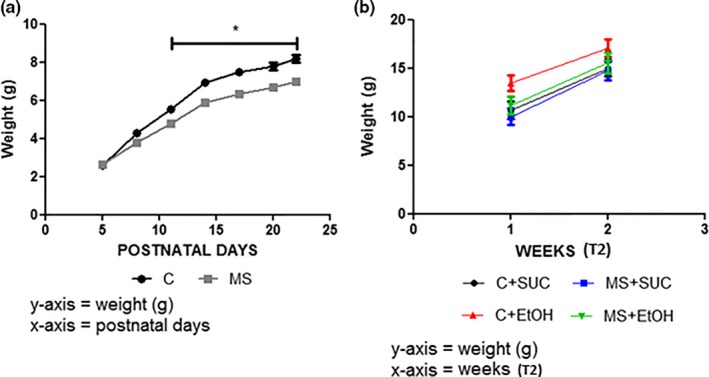
Figure 2.

Analysis of weight gain (g) at the end of experiment 1 (T1) and experiment 2 (T2). (a) Weight gain (g) for groups MS and control (C) during T1. (b) Weight gain (g) for groups C+SUC, MS+SUC, C+EtOH and MS+EtOH during two weeks of T2. Experimental design is described in Figure 1. All experimental groups were composed of seven animals (n = 7). Data are expressed as mean and standard error. Two‐way ANOVA and Bonferroni's post hoc test correction were used to determine statistically significant differences between the groups in (a) and (b). *p < .05 C versus MS (T1)
