
Figure 4.
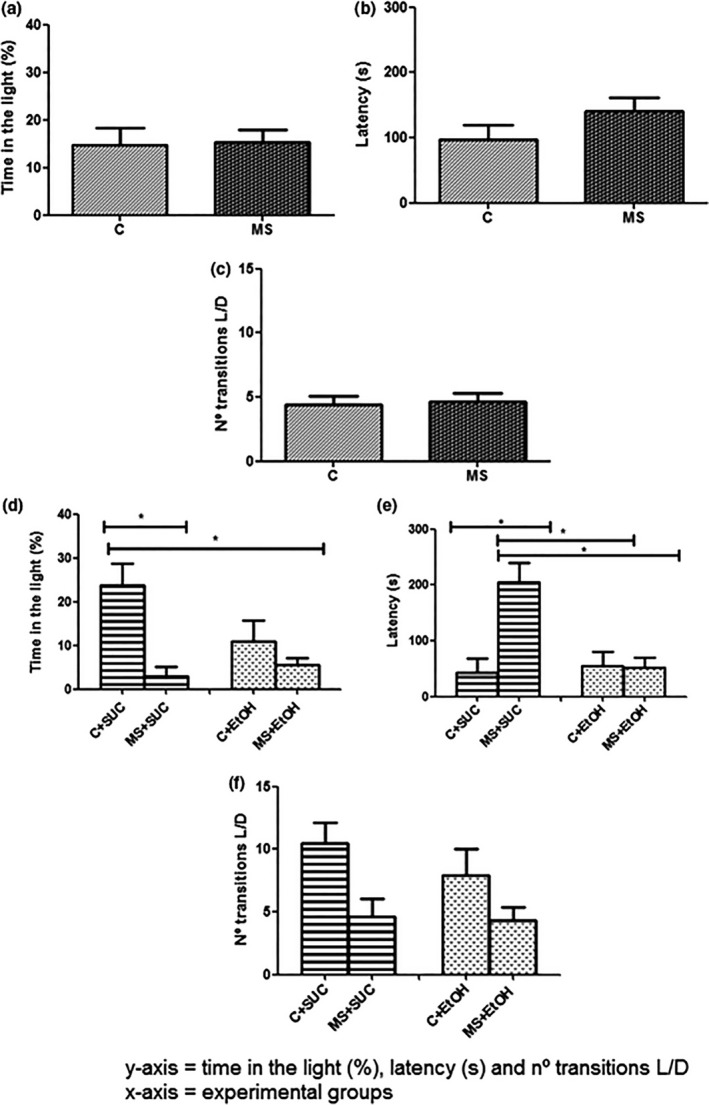
Light/dark box behavioral test at the end of experiment 1 (T1) and experiment 2 (T2). Proportion of time (%) spent in the light compartment following T1 (a) and T2 (d); Latency at the end of T1 (b) and T2 (e); and total number of transitions between the light and dark compartments following T1 (c) and T2 (f). Experimental design is described in Figure 1. All experimental groups were composed of seven animals (n = 7). Data are expressed as mean and standard error. Student's t‐test was used to analyze the differences between the groups C and MS in (a), (b) and (c) and between the groups C+SUC and MS+SUC and the groups C+EtOH and MS+EtOH in (d), (e) and (f). *p < .05 C+ SUC versus MS+ SUC (T2)