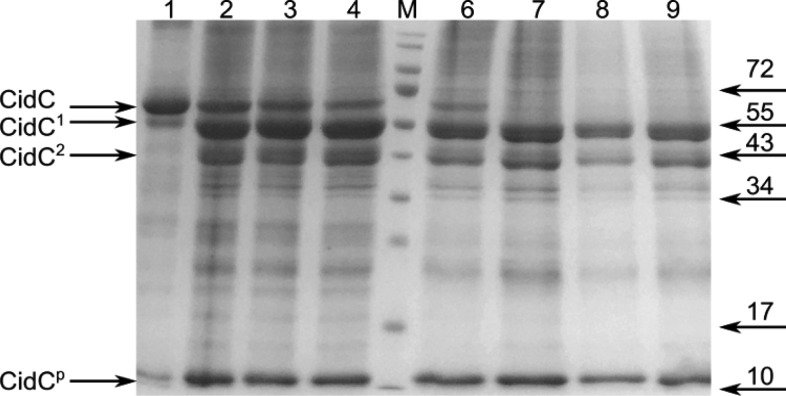
Figure 6.
Proteolysis of CidC. SDS–PAGE showing the CidC cleavage products after incubation with trypsin for 30 min at pH 6 (lanes 1–4) and pH 7 (lanes 6–9). Before proteolysis, CidC was incubated with (lanes 1 and 6) pyruvate, TPP, and Mg2+, (lanes 2 and 7) TPP and Mg2+, (lanes 3 and 8) pyruvate, and (lanes 4 and 9) Mg2+. CidC products are shown at the left with CidC1 and CidC2 being several kilodaltons and ∼20 kDa, respectively, smaller than CidC, while CidCp indicates small peptides. Several bands from the marker (lane M) are labeled at the right.

