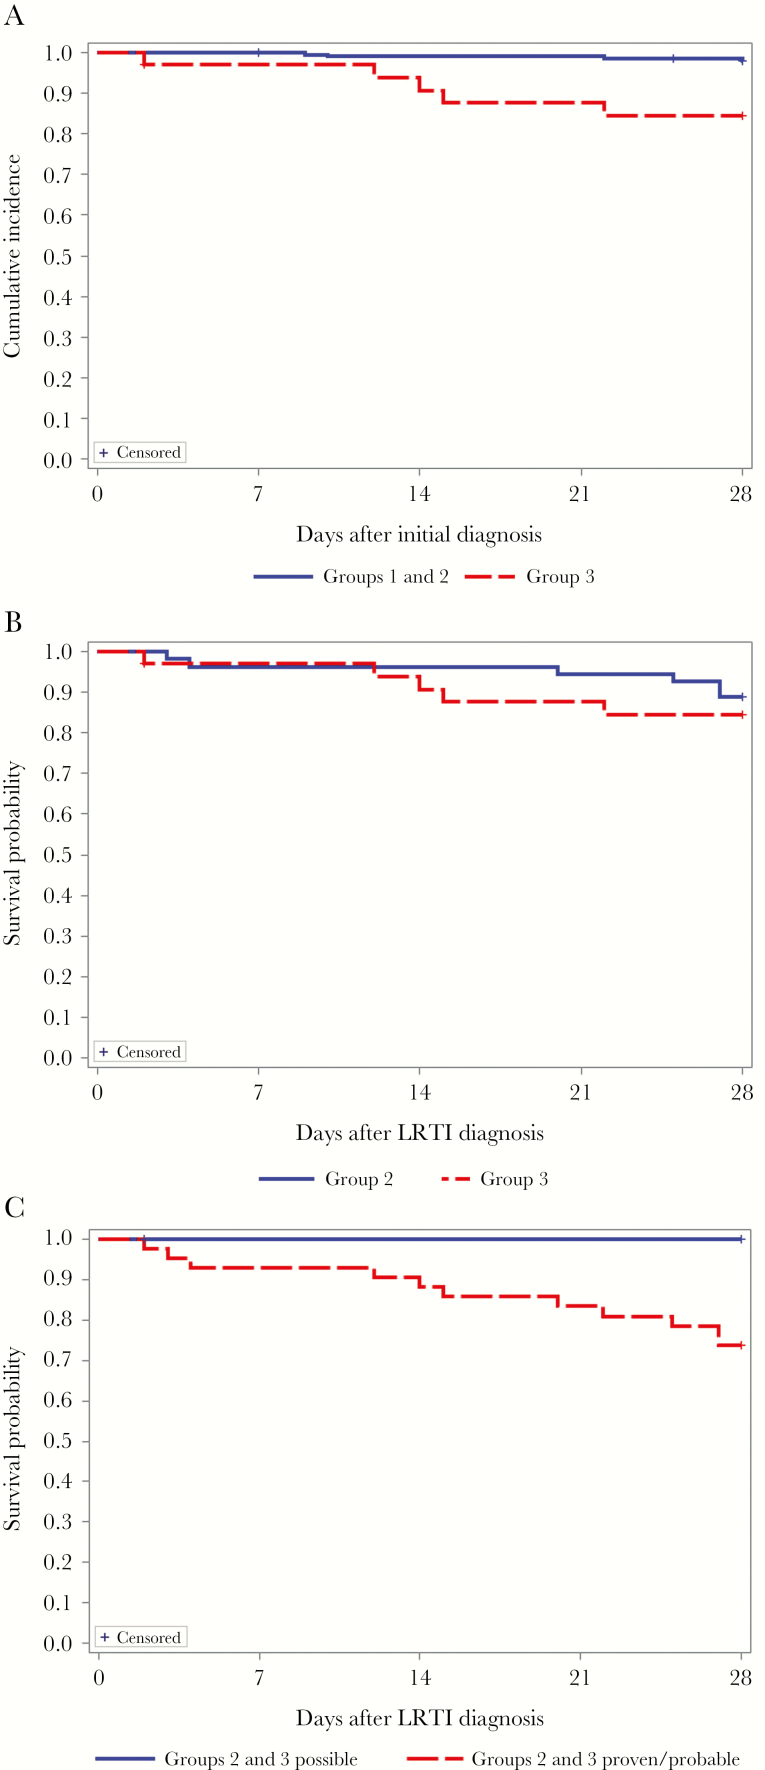
Figure 2.
Unadjusted Kaplan-Meier curves for overall survival at day 28 for groups 1 and 2 versus group 3 following initial diagnosis of respiratory syncytial virus (RSV) infection (P = .0002, by the log-rank test; A), for group 2 versus group 3 following RSV LRTI (P = .514, by the log-rank test; B), and for groups 2 and 3 possible versus groups 2 and 3 proven/probable (the log-rank test could not be performed because of a lack of events in possible group; C).

