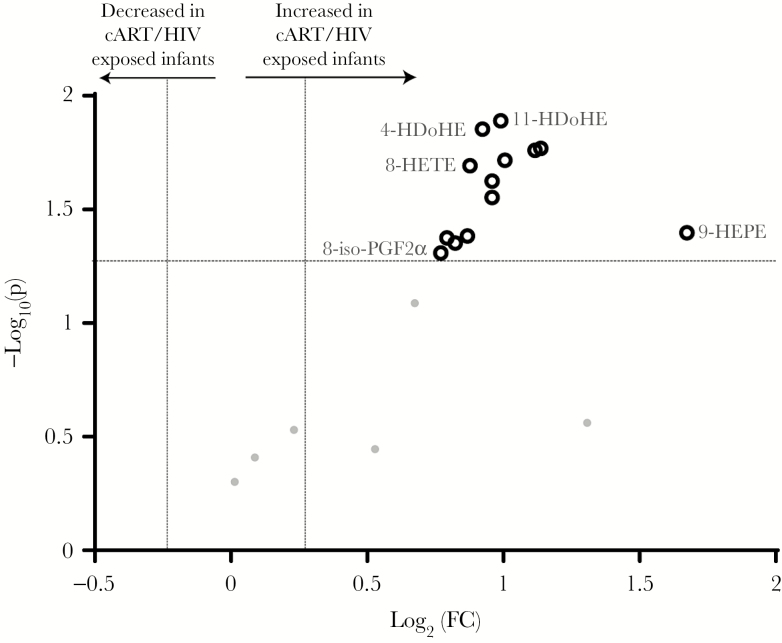
Figure 1.
Volcano plot of the reactive oxygen species–produced oxylipin profiles of combination antiretroviral therapy (cART)/human immunodeficiency virus type 1 (HIV-1)–exposed infants vs control infants. Thirteen metabolites were identified as significantly increased (black rings) in the cART/HIV-1–exposed-infants compared to control infants. Volcano plots visualizes the log10 (Mann–Whitney P value) on the y-axis and the log2 (fold change [FC]) on the x-axis for each metabolite compared between the cART/HIV-1–exposed infants vs control infants. The dotted lines represent the significance thresholds with FC > 1.25 and FC < 0.75 on the x-axis and P < .05 on the y-axis. Abbreviations: 8-iso-PGF2α, 8-iso-prostaglandin F2α; cART, combination antiretroviral therapy; FC, fold change; HDoHE, hydroxyl-docosahexaenoic acid; HEPE, hydroxy-eicosapentaenoic acid; HETE, hydroxy-eicosatetraenoic acid; HIV, human immunodeficiency virus.

