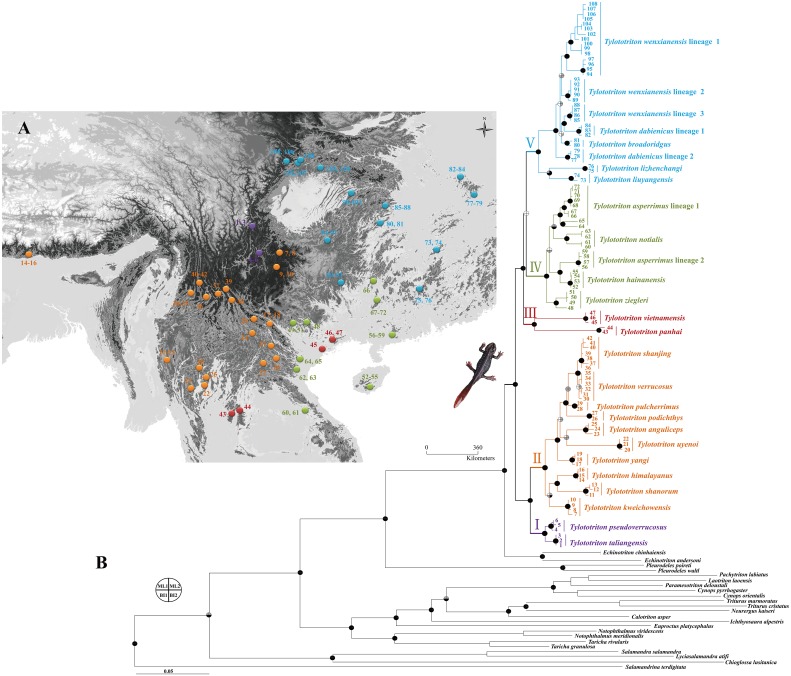
Figure 1. Sampling localities (A) and Maximum likelihood (ML) tree obtained based on mtDNA data of Tylototriton s.l. and relatives (B).
Sample number 1–108 refer to Table S1. Five clades (I, II, III, IV and V) of the genus were denoted as different colors. Bootstrap supports (bs) resulted from ML analyses and posterior probability (pp) resulted from Bayesian inference (BI) method were labeled on major nodes. Node supports ML1 and BI1 were resulted from analyses on mtDNA data, while ML2 and BI2 were from analyses on four-gene concatenated data. Black: bs > 70% or pp > 0.95, grey: bs = 50–70% or pp = 0.85–0.95, white: bs < 50% and pp < 0.85.

