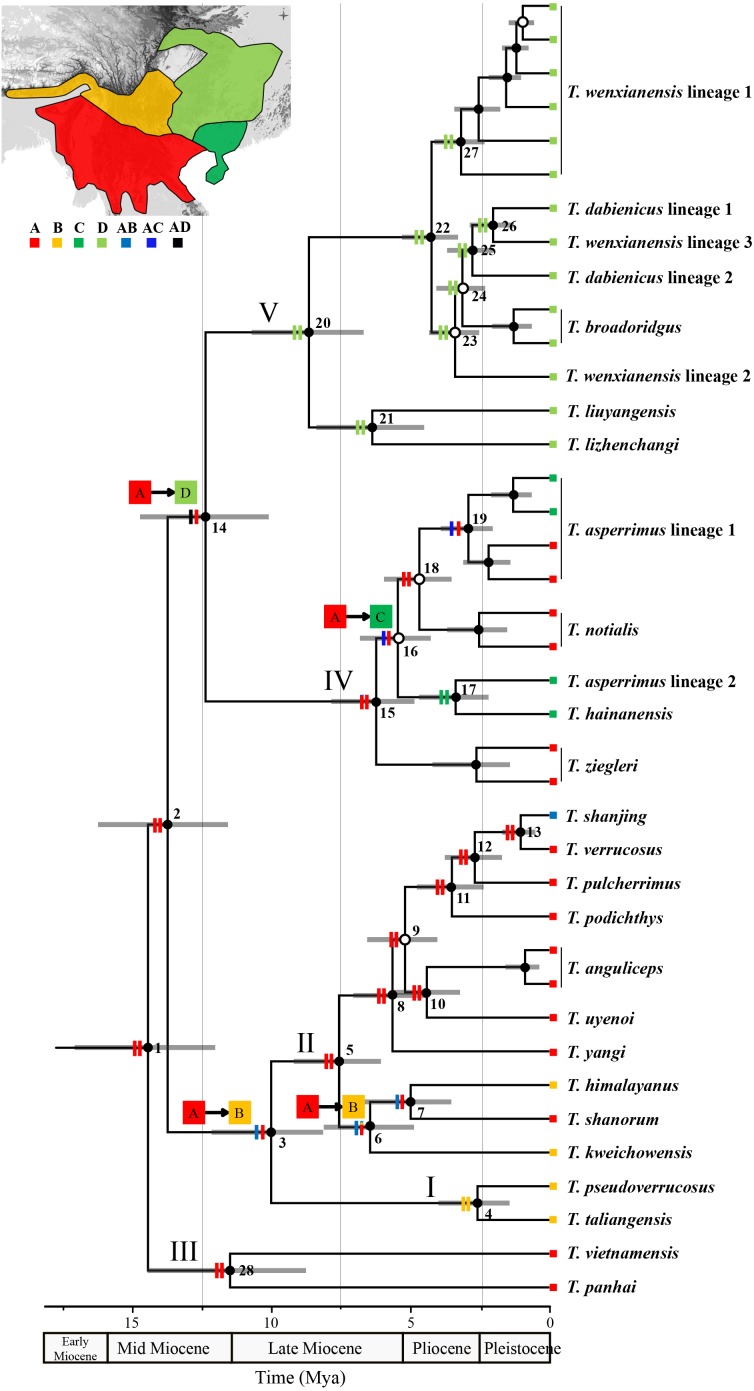
Figure 3. Chronogram and ancestral area reconstructions of Tylototriton s.l.
This tree was pruned from the final topology-constrained BEAST tree. Grey bars at nodes show 95% highest posterior density intervals of divergence times. Node number was denoted near each node. Black circles, Bayesian posterior probabilities (pp) = 0.95–1.0; open circles, pp < 0.95. Clades I V refer to Fig. 1. Two vertical bars on branch showed the relative probabilities of alternative ancestral distributions obtained by the S-DIVA (first bar) and BBM (second bar), and the first two areas with the highest probability are shown on each bar corresponding to relative probability. Four significant dispersals were highlighted near corresponding nodes using arrows linking the originated region to the dispersed region. (insert) four regions was denoted as different color: (A) Northern Indochina Peninsula and South Yunnan Province of China; (B) Southwest China mountains and Eastern Himalaya mountains; (C) Coastal areas of Southern China region and Hainan Island; (D) Central China region.

