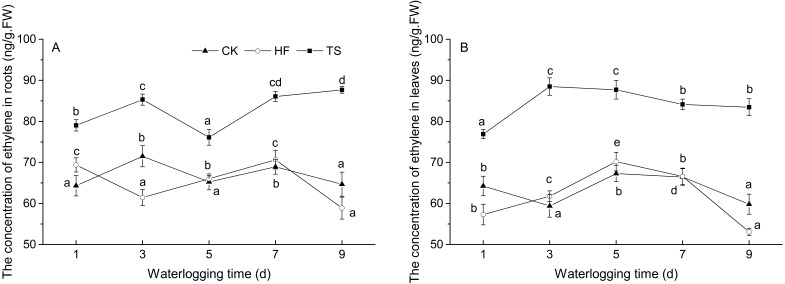
Figure 1. The change of ethylene concentrations under CK, HF and TS treatments.
Data points are the mean values and error bars represent the standard errors, which are from five biological replicates. (A) in roots; (B) in leaves. The difference of letters at the top of the line shows that there is a significant difference in ethylene content at different waterlogging times under the same degree of flooding treatment (P < 0.05).

