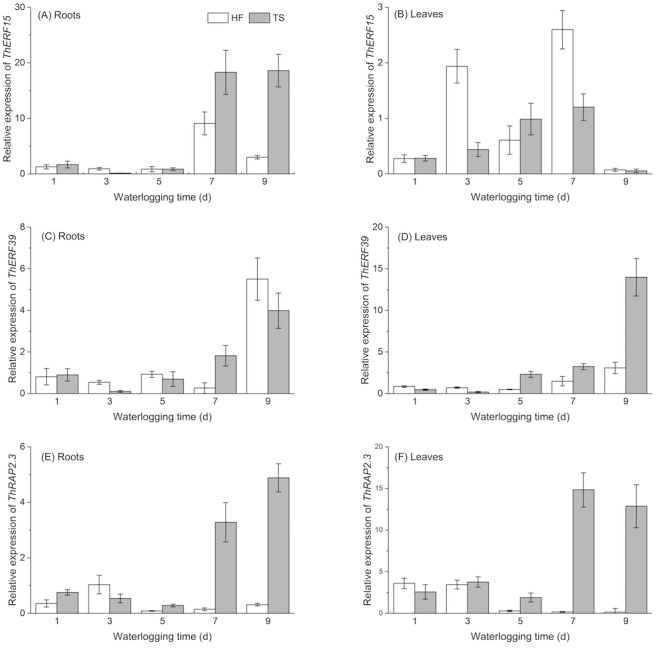
Figure 4. Temporal expression profiles of ThERF15, ThERF39 and ThRAP2.3 in roots and leaves by real-time PCR.

HF (half-flooding) and TS (total-submergence) are the two levels of flooding treatment. CK values, being references for two treatments on the same stage and tissue, were set to 1. Data points are the mean values and error bars represent the standard errors, which are from three biological replicates. (A, C, E) are temporal expression profiles of ThERF15, ThERF39 and ThRAP2.3 in roots; (B, D, F) are temporal expression profiles of ThERF15, ThERF39 and ThRAP2.3 in leaves.
