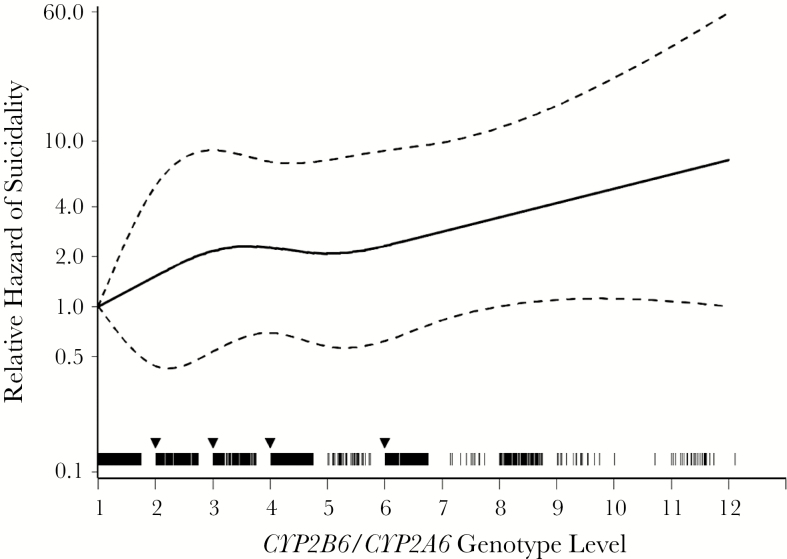
Figure 3.
Genotype level fit with a quadratic spline. CYP2B6/CYP2A6 genotype level was fit with a quadratic spline with 4 equally spaced knots at levels 2, 3, 4, and 6, as indicated by downward arrows. Each hash mark represents the participant’s observed genotype level (n = 1833); solid line, the estimated relative hazard; and dashed lines, pointwise 95% Wald-type confidence intervals from a weighted Cox model stratified by race/ethnicity group. This provides support for the assumption of a linear association with no apparent threshold effect. The unweighted result was similar and slightly closer to linear (data not shown).

