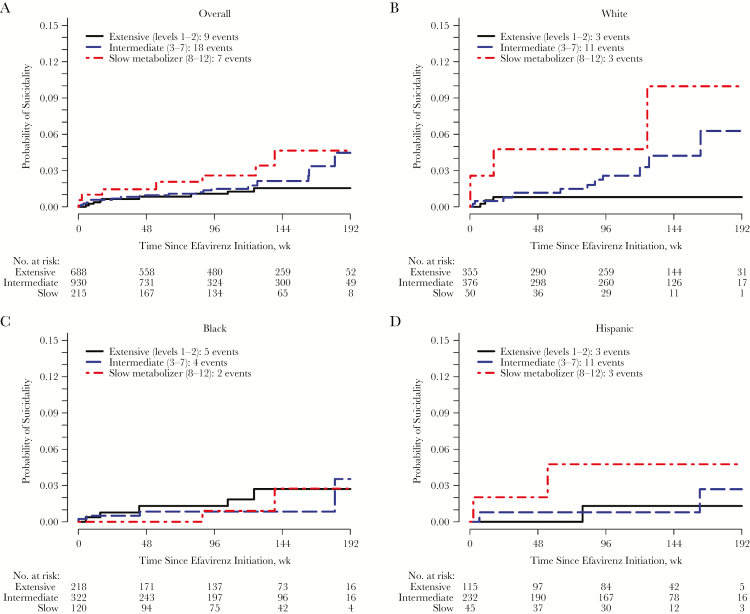
Figure 4.
Cumulative probability of suicidality for each metabolizer group in on-treatment analysis, overall and by race/ethnicity. A, Estimated cumulative probability of suicidality for each metabolizer group is shown overall among all participants (A) and among white (B), black (C), and Hispanic (D) participants. Values for probability represent 1 minus the weighted Kaplan-Meier estimate; on-treatment analyses are shown. The unweighted number at risk is shown below each panel, and the number of suicidality events is provided in the key.

