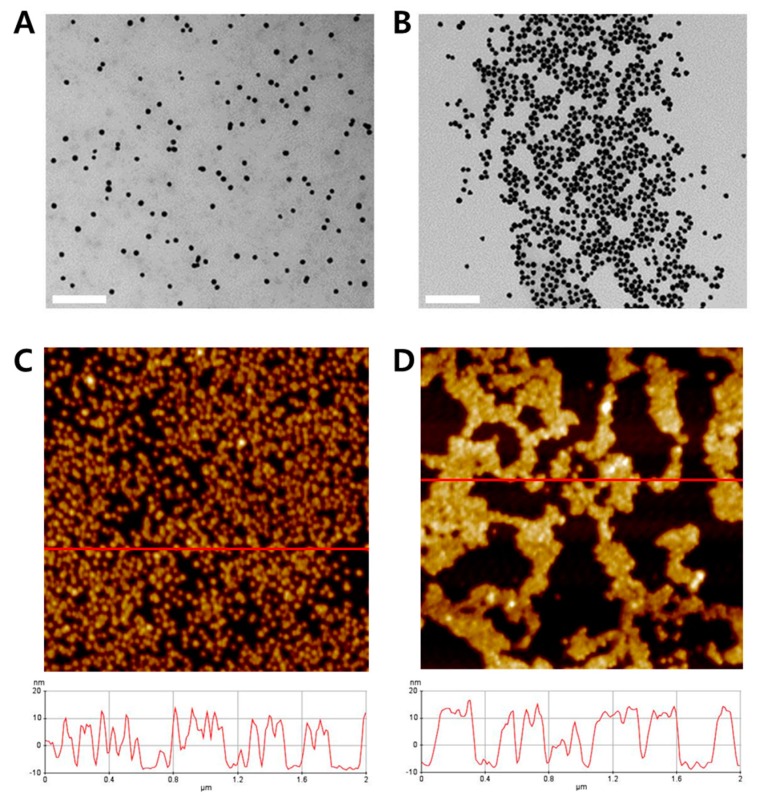
Figure 3.
Transmission electron microscopy (TEM) images and atomic force microscopy (AFM) analysis results of: the non-reaction sample with AuNP probes alone (A,C); and RCA reaction sample with AuNP probes (B,D), respectively. The length of the inset scale bar in the TEM images is 200 nm. The horizontal red lines of the AFM images indicate the analysis range of height profile, and lower graphs of the AFM images indicate the height profiles of each sample.

