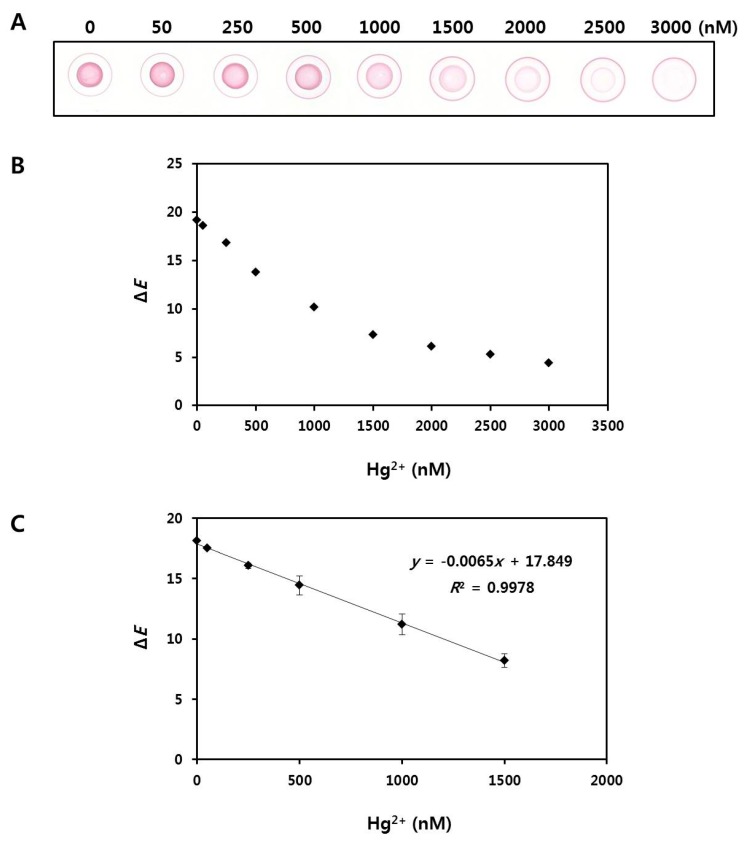
Figure 6.
(A) Digital scanned image of the paper after drop-drying of nine samples with different Hg2+ concentrations (0, 50, 250, 500, 1000, 1500, 2000, 2500, and 3000 nM); (B) Color intensities (ΔE) of the nine samples measured by a portable spectrophotometer; and (C) Linear correlation between Hg2+ concentrations (0, 50, 250, 500, 1000 and 1500 nM) and ΔE values (n = 3).

