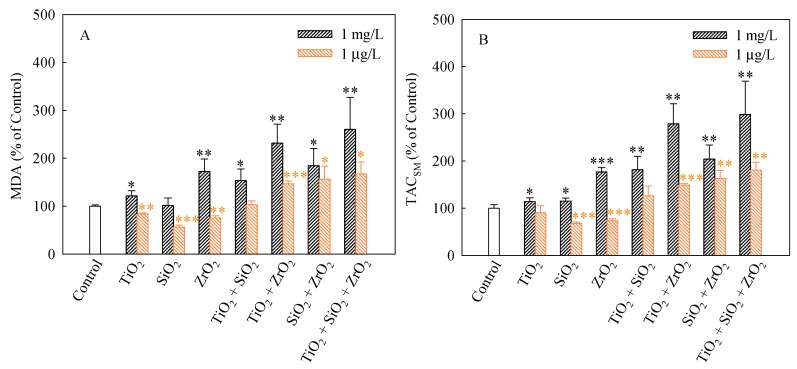
Figure 5.
Levels of MDA (A) and TACSM (B) in S. obliquus exposed to 1 mg/L and 1 μg/L of NPs alone, 1 mg/L and 1 μg/L of single NPs in binary combination and 1 mg/L and 1 μg/L of single NPs in ternary combination. Statistical significance versus control group: * p < 0.05, ** p < 0.01 and *** p < 0.001.

