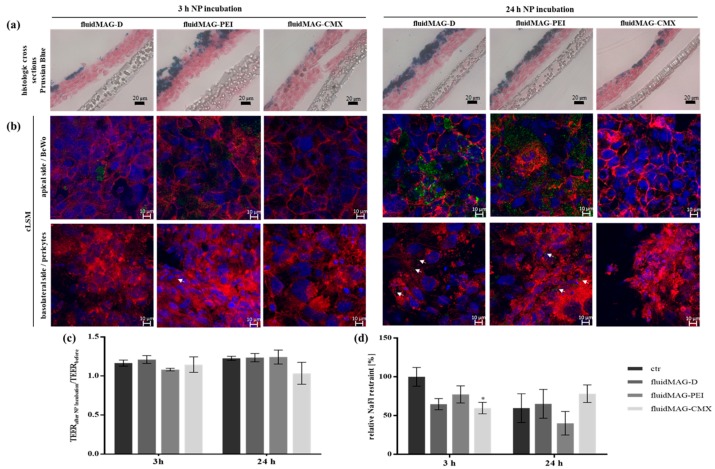
Figure 2.
Analysis of the barrier integrity and morphology of the transwell co-culture BPB model after exposure to different SPIONs for 3 h or 24 h. For the co-culture model, 1.1 × 10⁶ cells cm−2 of pericytes were seeded onto the basolateral side of 24-well membrane inserts and 6.1 × 10⁵ cells cm−2 of BeWo cells were seeded on the apical side of the insert membrane after 24 h. On day four post seeding (PS), barrier models were exposed to 100 µg cm−2 (200 µg mL−1) of D/PEI/CMX-coated SPIONs for 3 h or 24 h. (a) After SPION exposure, histologic cross sections of cell grown transwell membranes were prepared and stained with Nuclear Fast Red and Prussian blue. Scale bars represent 20 µm. (b) For the analysis by confocal laser scanning microscopy (cLSM) samples incubated with fluorescently labeled SPIONs (green) were fixed and stained with Hoechst 33258 (blue) and Alexa Fluor® 633 phalloidin (red). White arrows mark SPION aggregates in pericyte cell layer. Scale bars represent 10 µm. (c) Transepithelial electrical resistance (TEER) values measured in triplicates per insert before and after SPION exposure were compared for each condition. Shown are the mean values of the quotient of measured TEER values before/after SPION incubation ± standard deviation of three independent experiments. (d) The passage of the permeability marker sodium fluorescein (NaFlu) through the barrier after SPION incubation was measured in duplicates for each condition and the calculated permeability coefficients were normalized to blank membranes. Shown are mean values of the x-fold NaFlu retention ± standard deviation of three independent experiments. The significance of the results compared to respective control measurements without SPIONs was tested using two-way analysis of variance (ANOVA) following Tukey’s multiple comparison test. Statistically significant differences are depicted as: * p < 0.05. The corresponding p values for the comparison of all data sets for (c,d) are listed in Tables S2 and S3, respectively.

