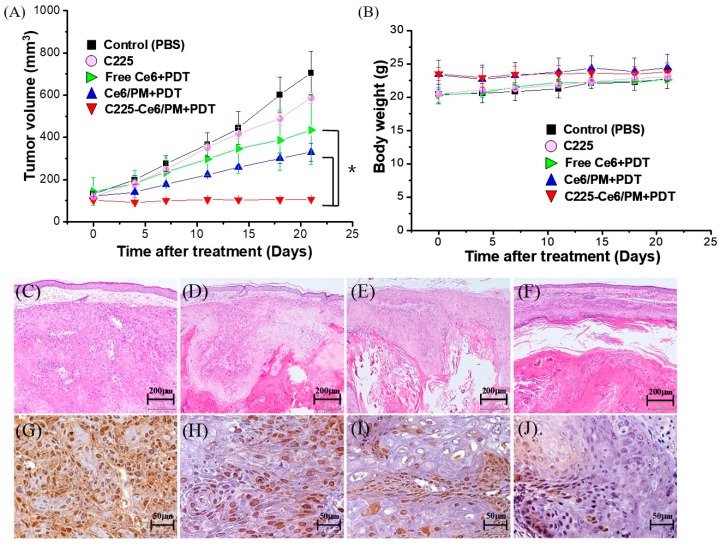
Figure 6.
(A) Regrowth curves and (B) relative weight curves of A431 tumors in nude mice submitted to photodynamic therapy (PDT) treatment. The data are presented as the means ± standard deviation. * Significantly different compared with the control or non-tumor targeting PDT-treated groups (p < 0.05). Hematoxylin and eosin (H&E) and proliferating cell nuclear antigen (PCNA) staining of A431 xenograft tumors treated with phosphate-buffered saline (PBS) or micellar Ce6 with irradiation. (C,G) Control. (D,H) Ce6-PDT; (E,I) Ce6-PDT/PM; (F,J) C225-Ce6/PM-PDT. (C–F): H&E staining. (G–J): PCNA staining.

