. 2017 Sep 25;8(12):8025–8029. doi: 10.1039/c7sc03772d

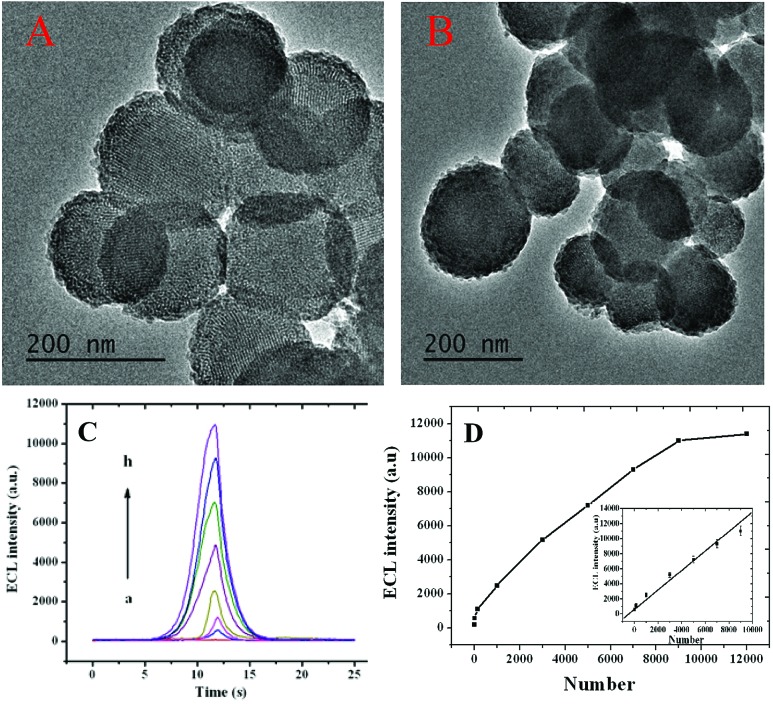
Fig. 2. TEM image of synthesized (A) MSNs and (B) T-primer DNA-closed MSN@PMA. (C) The relationship between the ECL intensity and the number of HL-60 cancer cells, the number of HL-60 cancer cells is 0, 15, 150, 1000, 3000, 5000, 9000 and 11 000 from (a) to (h) respectively. (D) A line chart of the relationship between the ECL intensity and the number of HL-60 cancer cells; inset: the linear relationship between the ECL intensity and the number of HL-60 cancer cells, which is 15, 150, 1000, 3000, 5000 and 9000. The detection was performed in 0.1 M PBS (PH = 7.4) containing 0.1 M KCl. The applied potential ranged from –0.8 V to 1.2 V at 100 mV s–1.

Fig. 2