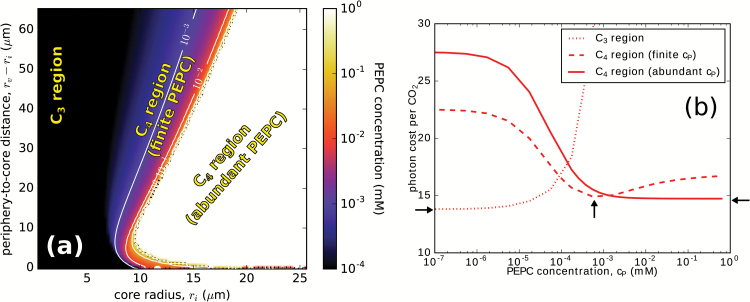
Fig. 2.
C4-optimized PEPC levels. (a) Optimal PEPC concentration as a function of the core radius, ri, and the periphery to core distance, rv–ri, for a cell at 20 °C with Rubisco concentration of cR=2 mM and cellular barrier permeability of σB=100 μm. Other parameters are as in Table 1. Level lines are in white. The abundant PEPC region, which appears white, has PEPC concentration >1 mM; the black region on the left is the C3 region, with zero PEPC concentration. (b) Dependence of the photon cost on PEPC concentration, cP, at three exemplary points in different regions of (a), with co-ordinates ri=5.5 μm, 10.5 μm, and 12.6 μm, and rv–ri=26 μm. Arrows mark the positions of the photon cost minima (i.e. the optimal PEPC concentrations) in the three cases (discussed in the text).

