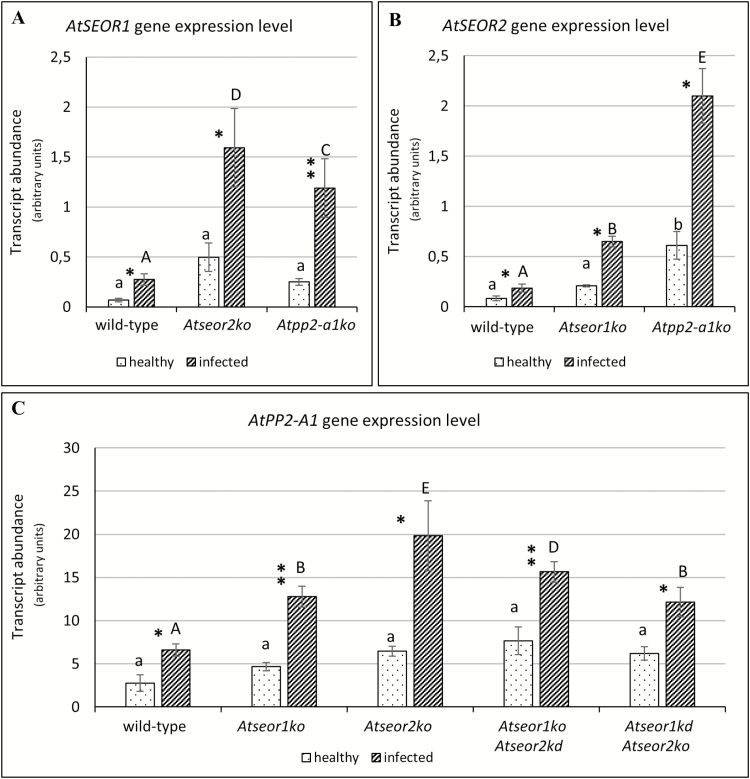
Fig. 13.
Gene expression level of healthy and infected wild-type and mutant A. thaliana lines. The expression of AtSEOR1 (A), AtSEOR2 (B), and AtPP2-A1 (C) genes was analysed in healthy and infected plants of both wild-type and mutant lines by real-time RT–PCR. Expression values were normalized to the UBC9 transcript level, arbitrarily fixed at 100, then expressed as mean normalized expression ±SD (transcript abundance). Every gene was significantly up-regulated in infected plants compared with healthy plants. No significant difference in expression was detected in healthy plants, except for AtSEOR2 in Atpp2-a1ko plants. In infected plants, each gene was up-regulated in the mutants compared with the wild type. For each condition, three technical repeats from five different plants were carried out. Differences between healthy and infected conditions in each line were calculated using unpaired t-test. Family-wise significance and confidence level: 0.05. *P<0.05, **P<0.01. For comparisons among the different lines, two-way ANOVA followed by a Dunnett’s test was used, with wild-type values as control. Family-wise significance and confidence level: 0.05. Different letters indicate different significance levels. Healthy plants: a, no significant difference from wild-type values; b, P<0.05. Infected plants: A, no significant difference from wild-type values; B, P<0.05; C, P<0.01, D, P<0.001, E, P<0.0001.

