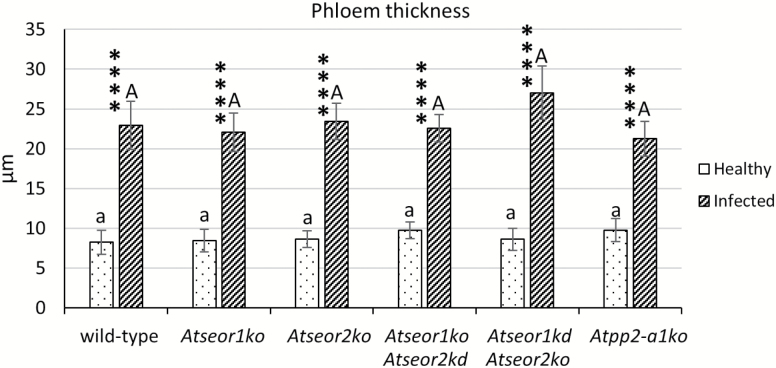
Fig. 5.
Midrib phloem thickness in healthy and infected wild-type and mutant A. thaliana lines. Following infection, a strong increase in phloem size occurred, due to phloem hyperplasia. Both among healthy plants and among infected plants, no significant difference was detected. The phloem thickness was measured in three different randomly selected measuring points in three different non-serial cross-sections from five healthy and five infected samples per line. The results are expressed as the mean ±SD. For each condition, five non-serial sections from five different plants were analysed. Differences between healthy and infected conditions in each line were calculated using Mann–Whitney test. Family-wise significance and confidence level: 0.05. ****P<0.0001. For comparisons among the different lines, two-way ANOVA followed by a Dunnett’s test was used, with wild-type values as control. Family-wise significance and confidence level: 0.05. A, a: no significant difference from wild-type values.

