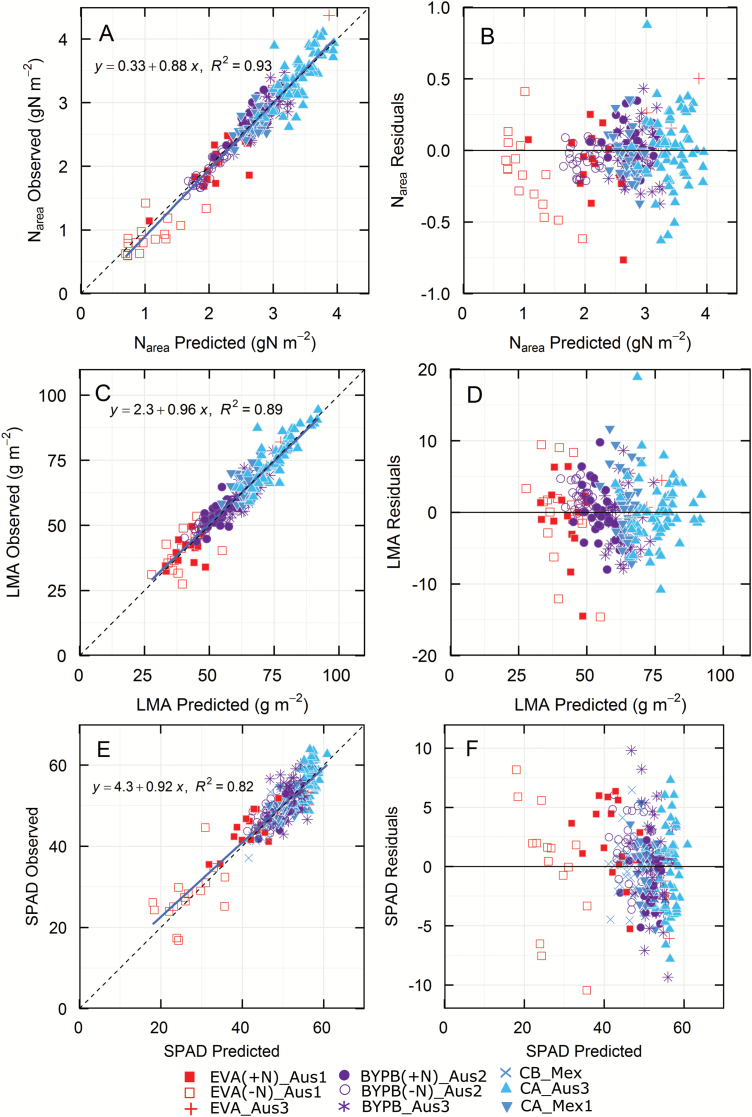
Fig. 2.
Validation of predictions (A, C, E) and residuals (B, D, F) for Narea (21 components), LMA (21 components), and SPAD (16 components). Symbols show only the validation data, i.e. those that were not used to construct the models. See Table 2 for details. (This figure is available in color at JXB online.)

