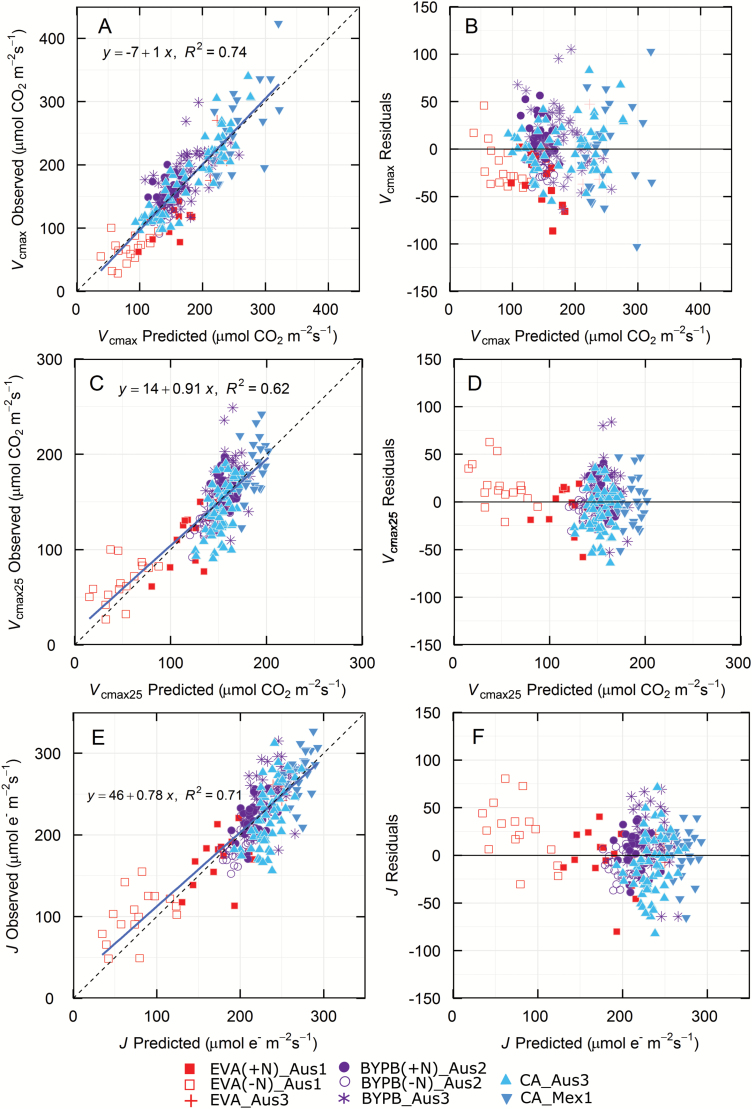
Fig. 3.
Validation of predictions (A, C, E) and residuals (B, D, F) for Vcmax (23 components), Vcmax25 (18 components) and J (18 components). Symbols show only the validation data, i.e. those that were not used to construct the models. See Table 2 for details. (This figure is available in color at JXB online.)

