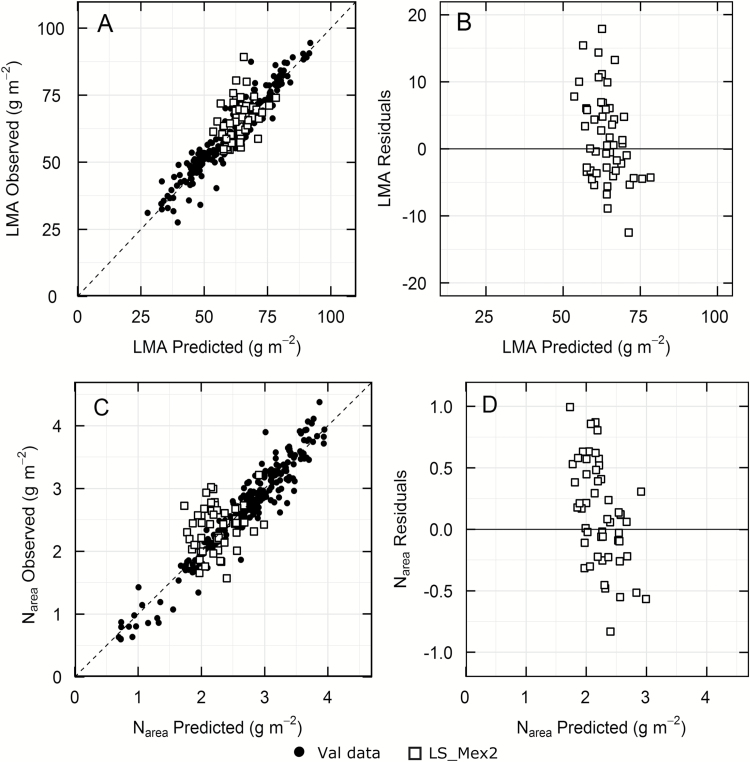
Fig. 6.
Comparison of predictions using the reflectance models for LMA (A) and Narea (C) against observed data for wheat landraces (LS-Mex2, open squares). The respective residuals are shown in (B) and (D). LS, n=52 and Val data, n=243. Closed circles are the validation data from Fig. 2A for Narea and Fig. 2B for LMA.

