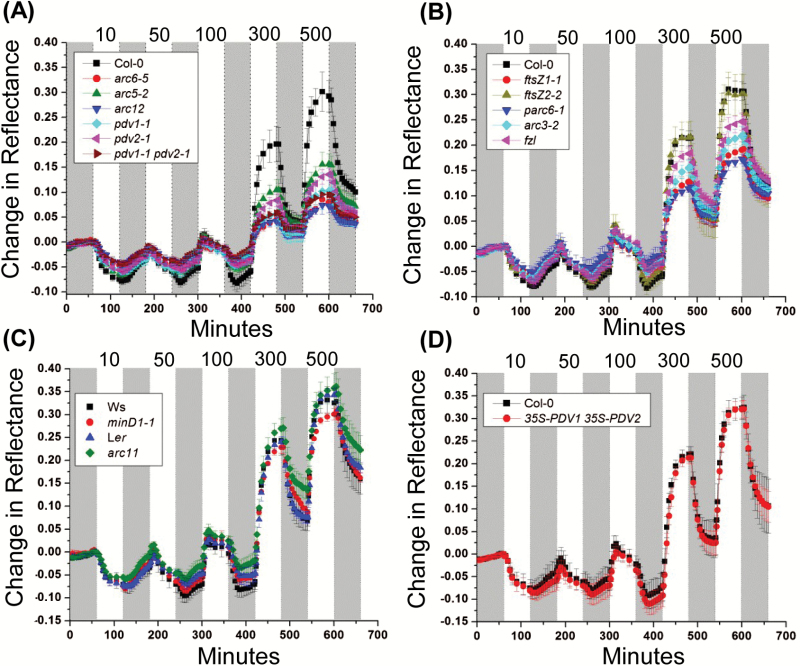
Fig. 2.
Chloroplast movement measurements in 18-day-old Arabidopsis plants of the indicated genotypes based on red light reflectance. Change in reflectance intensity versus time is shown during alternating 60 min periods of darkness (gray bars) or white light illumination (white bars) at the intensities indicated at the top of the graph (10–500 µmol m–2 s–1). For all data points, n=4–6 and error bars represent SDs. (A) Large-chloroplast mutants and the corresponding Col-0 wild type. (B) Intermediate-chloroplast mutants and the corresponding Col-0 wild type. (C) Intermediate-chloroplast mutants, minD1-1 and arc11 and their corresponding parental WTs, Ws and Ler, respectively. (D) 35S-PDV1 35S-PDV2 and the corresponding Col-0 wild type.

