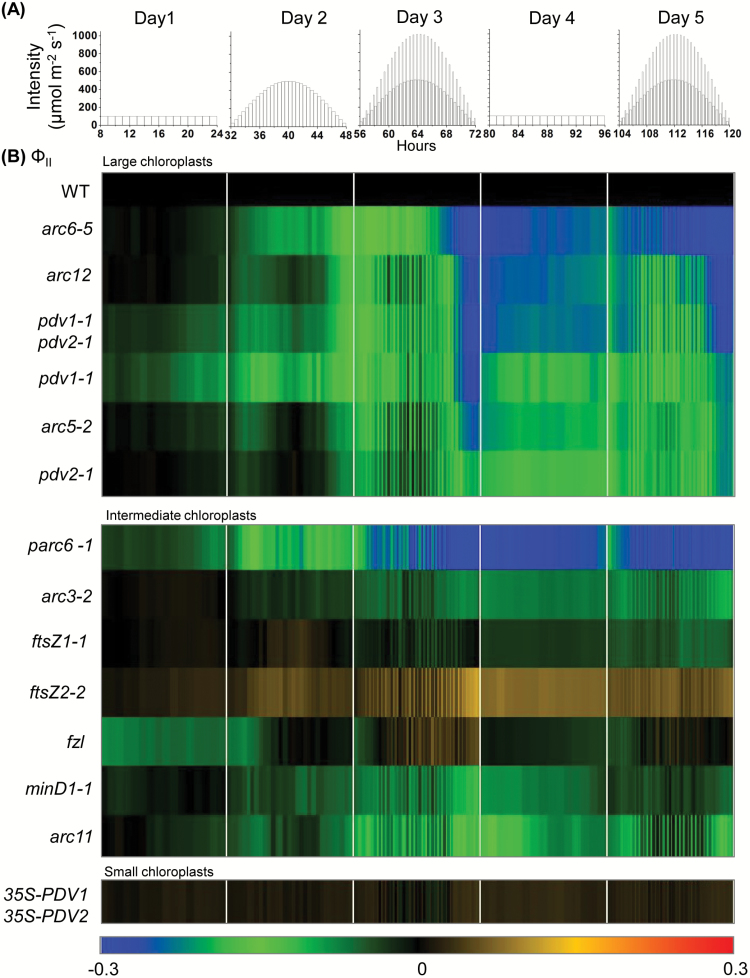
Fig. 3.
Changes in ΦII in the indicated genotypes during a 5 d course of varying light. (A) Five day light regime. (B) Heat maps of ΦII. Measurements were taken every 60 min on Days 1 and 4, and at the end of each light interval on all other days. The color scale at the bottom depicts the log-fold increase (red) or decrease (blue) in values in the mutants normalized against values in corresponding parental lines (WT; black) at each time point. Each data point represents the mean of measurements from 6–10 plants. Raw data and statistical analysis are shown in Supplementary Figs S3–S7.

