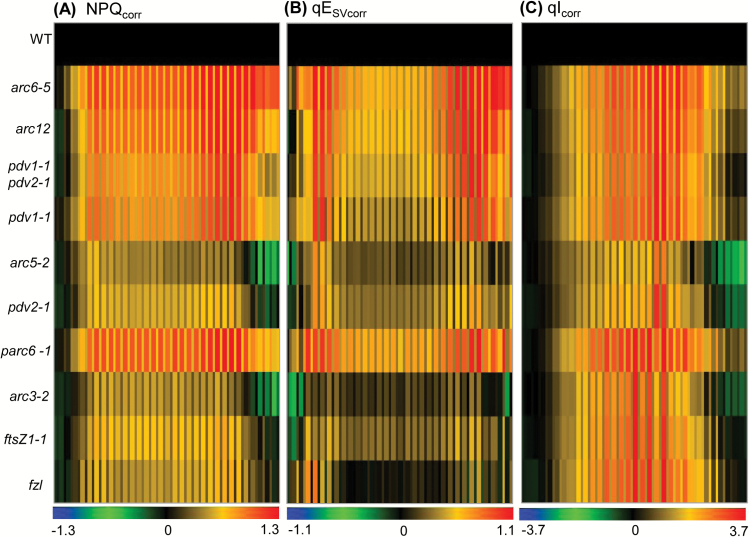
Fig. 6.
Heat map comparing non-photochemical quenching responses in Col-0 (WT) and chloroplast division mutants during a single day of fluctuating light as described for Fig. 5. Thick and thin bars represent ambient and fluctuating light intensities, respectively. The color scale at the bottom of each heat map depicts the log-fold increase (red) or decrease (blue) in values in the mutants normalized against values in the WT (black) at each time point. (A) NPQ, (B) qESV, and (C) qI values corrected for chloroplast movement. Each data point represents the mean of 4–6 plants. Raw data and statistical analysis are shown in Supplementary Figs S12, S13, and S15.

